Movements
The Airport’s Master Plan foreshadows that movement numbers will continue to grow.
Movement figures for all airports, including Jandakot, are published monthly in the Movements at Australian Airports reports.The movement data used in this report is collected during the hours when the control tower is open. Flights outside these hours are not included in the report. Jandakot Airport tower is open on Mondays to Fridays from 7 am to 8 pm and on weekends between 8 am and 6 pm in June and August. Between September and May the tower is open one hour later each weekday.
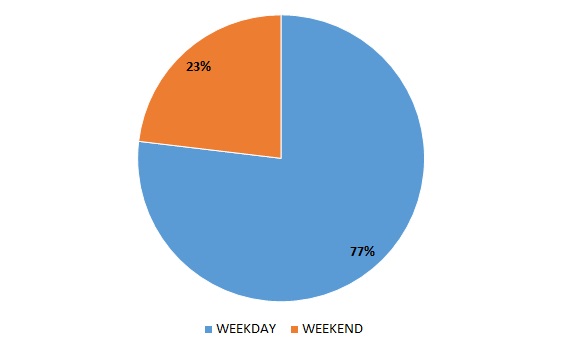
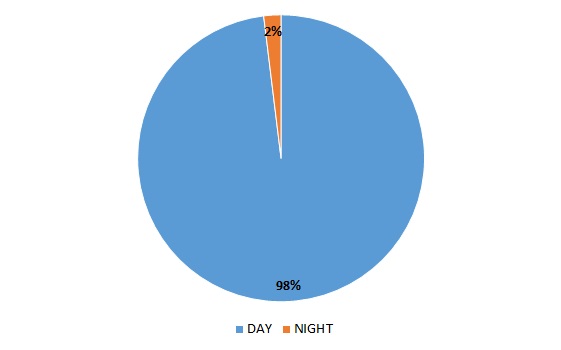
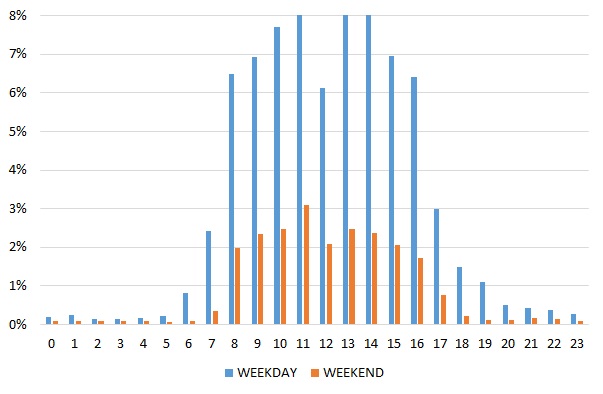
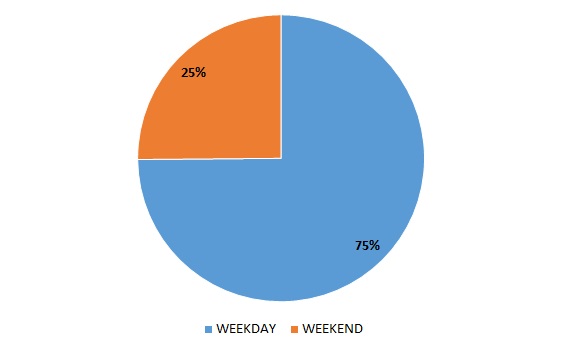
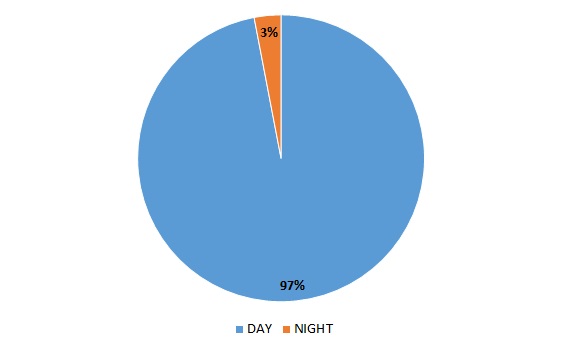
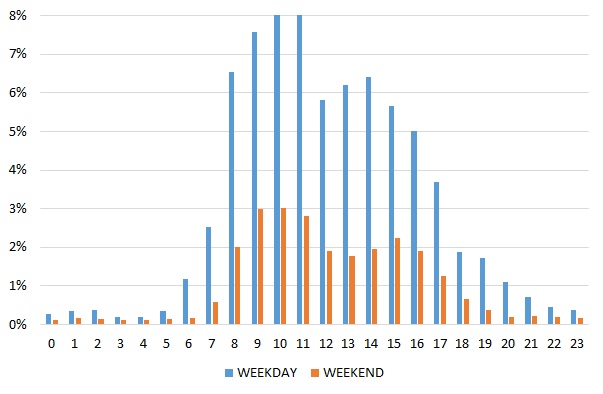
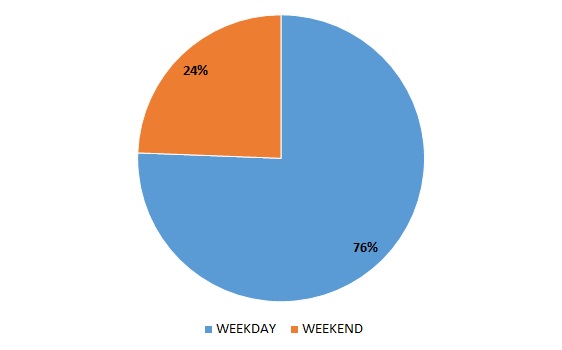
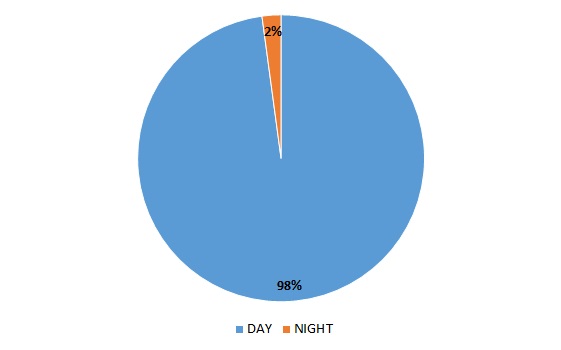
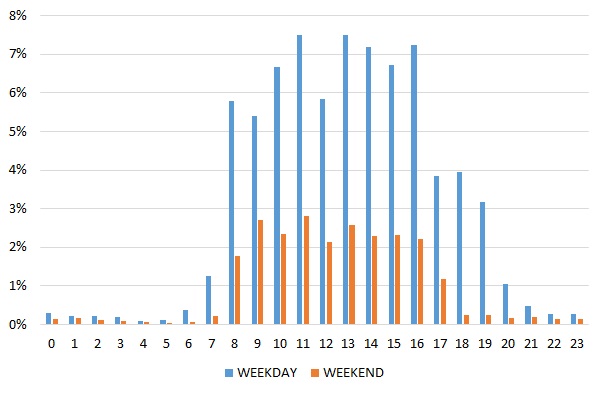
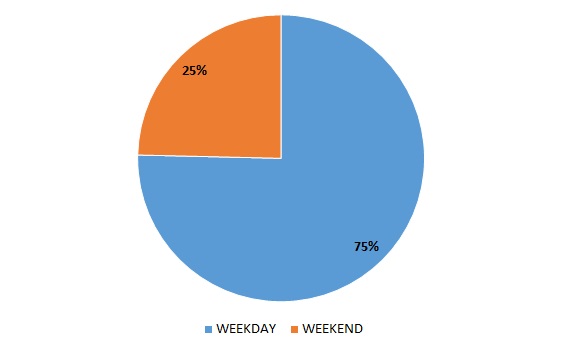
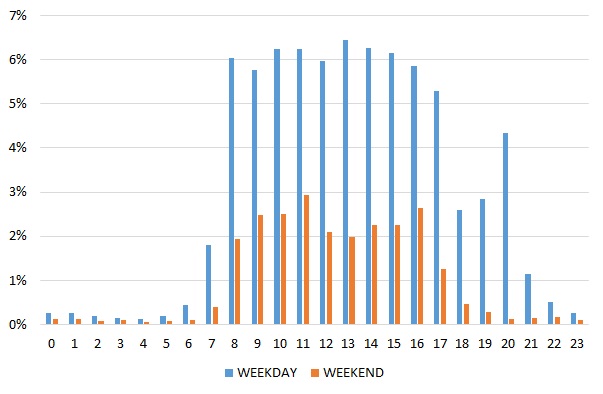
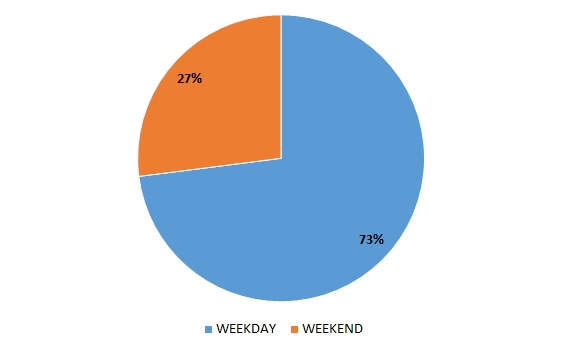
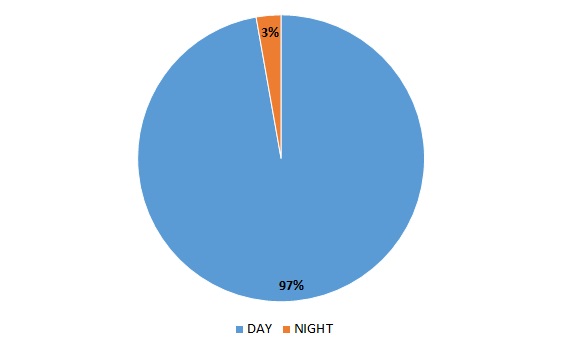
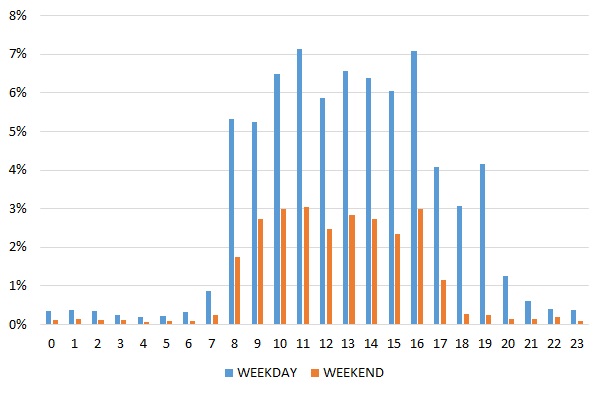
Select a quarter below to see charts illustrating the breakdown of movements for each quarter. These charts include arrivals and departures as well as flights that both begin and end at Jandakot Airport, including circuits and training flights. The breakdowns are shown as percentages rather than total counts. This is because the source radar data for Jandakot Airport has gaps due to the location of the radar at Perth Airport. As these gaps occur randomly throughout the day, the data, while incomplete, provides a representative picture of the weekly, hourly and day/night distribution of operations.
Total movements – percentage by weekday / weekend
Total movements – percentage by day / night
“Day” is 6am to 11pm and “night” is 11pm to 6am.
Total movements – percentage per hour by weekday/ weekend
Track density
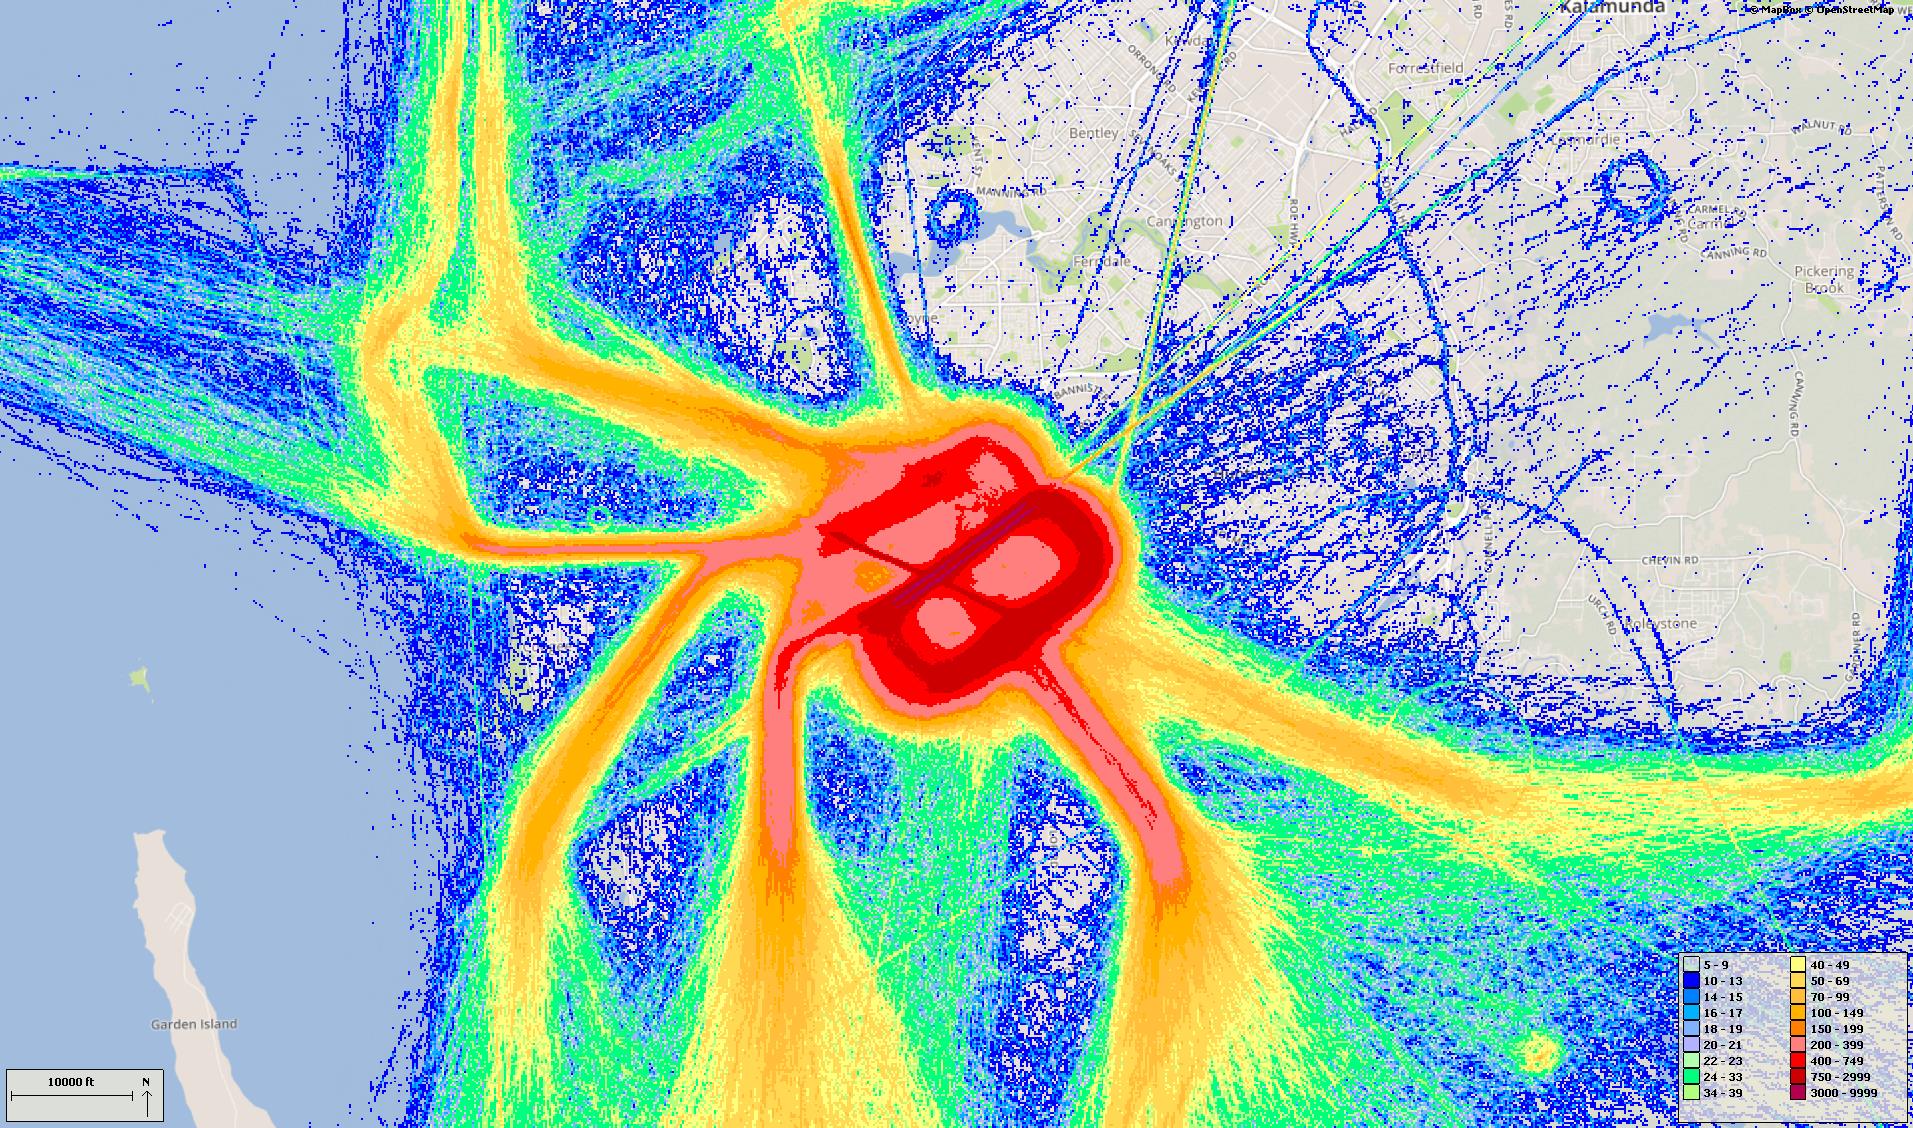
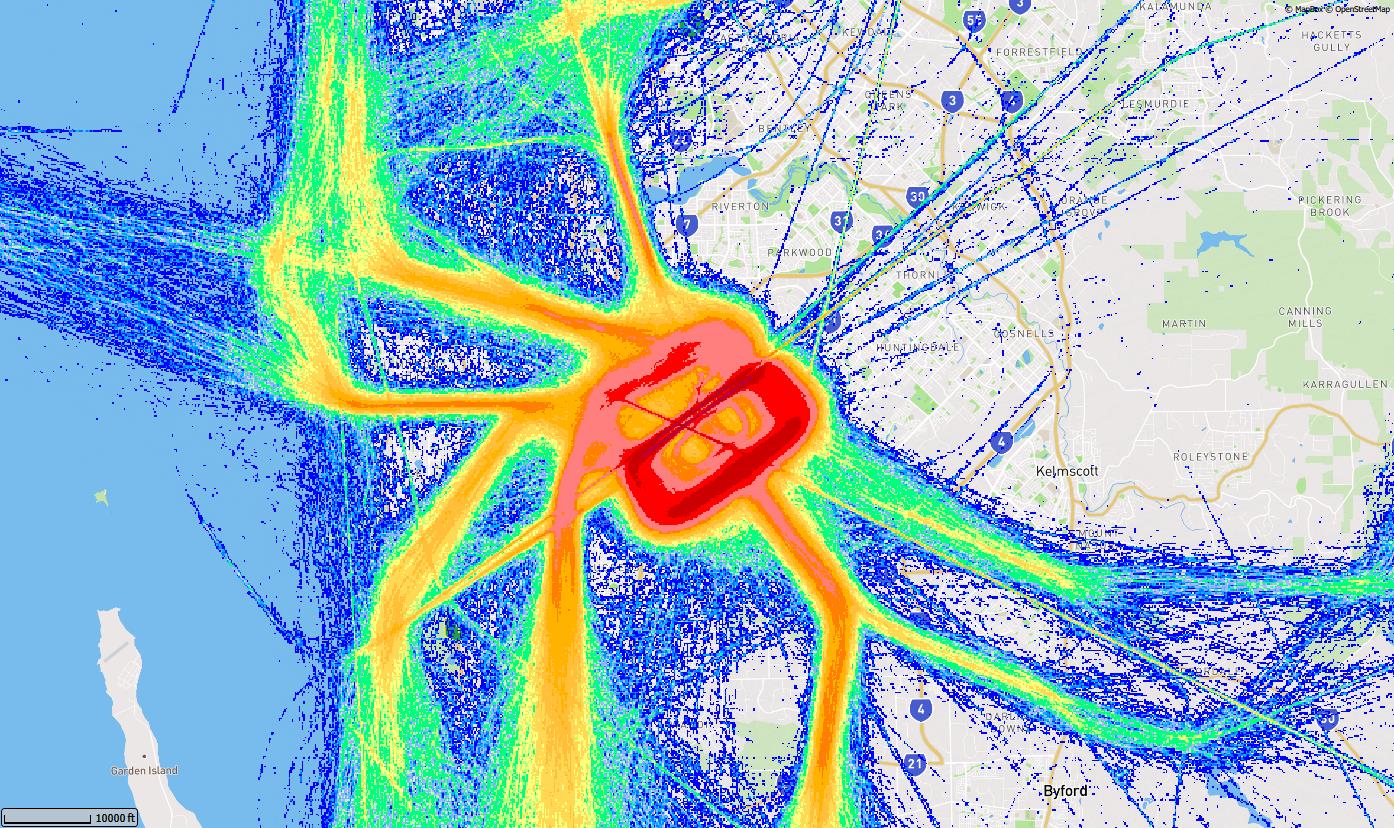
The following graph shows the density of movements over different suburbs in the quarter. This includes all arrival, departure and circuit movements.
The colours indicate the density of movements over the area. The hotter and deeper the colour, the more movements.
Click the image to enlarge it and return to this page by using the “Back” button in your browser.
Total movements – percentage by weekday / weekend
Total movements – percentage by day / night
“Day” is 6am to 11pm and “night” is 11pm to 6am.
Total movements – percentage per hour by weekday/ weekend
Track density
The following graph shows the density of movements over different suburbs in the quarter. This includes all arrival, departure and circuit movements.
The colours indicate the density of movements over the area. The hotter and deeper the colour, the more movements.
Click the image to enlarge it and return to this page by using the “Back” button in your browser.
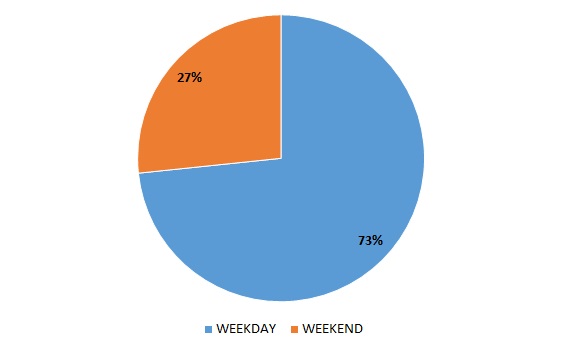
Total movements – percentage by weekday / weekend
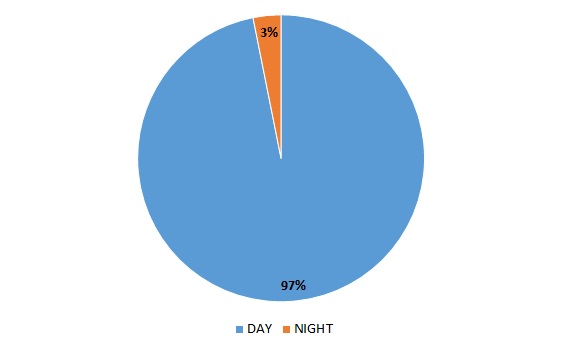
Total movements – percentage by day / night
“Day” is 6am to 11pm and “night” is 11pm to 6am.
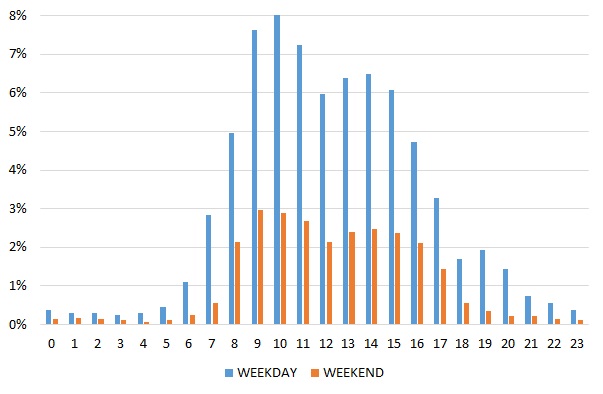
Total movements – percentage per hour by weekday/ weekend
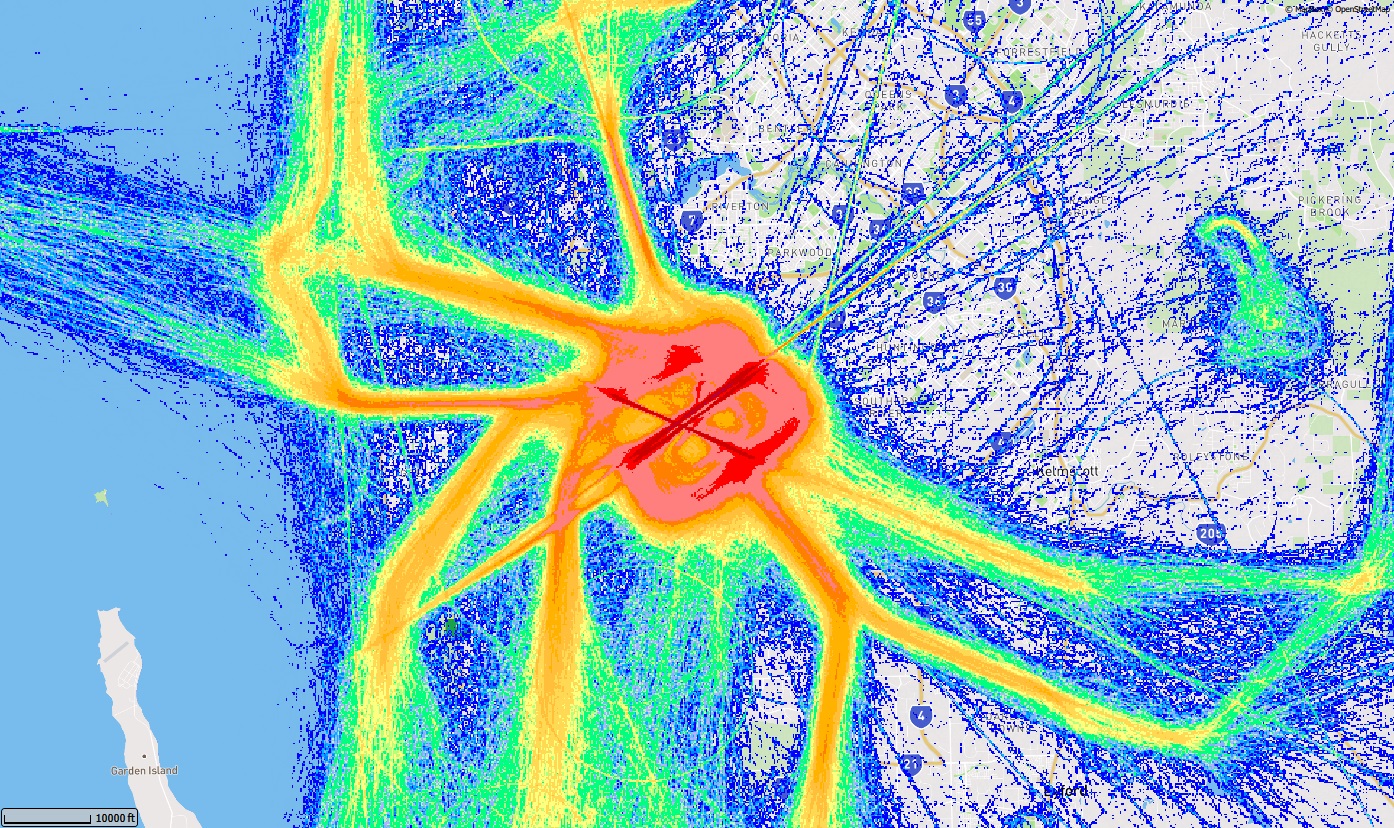
Track density
The following graph shows the density of movements over different suburbs in the quarter. This includes all arrival, departure and circuit movements.
The colours indicate the density of movements over the area. The hotter and deeper the colour, the more movements.
Click the image to enlarge it and return to this page by using the “Back” button in your browser.
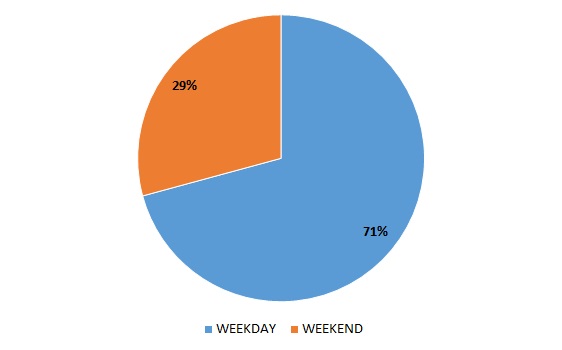
Total movements – percentage by weekday / weekend
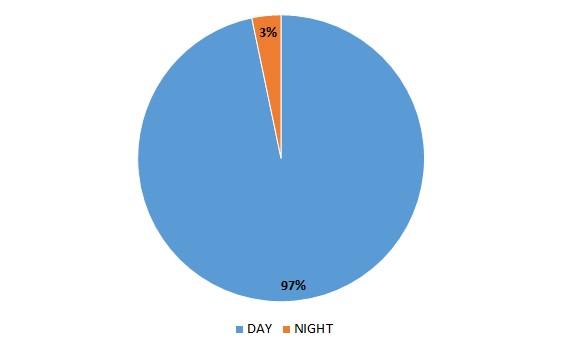
Total movements – percentage by day / night
“Day” is 6am to 11pm and “night” is 11pm to 6am.
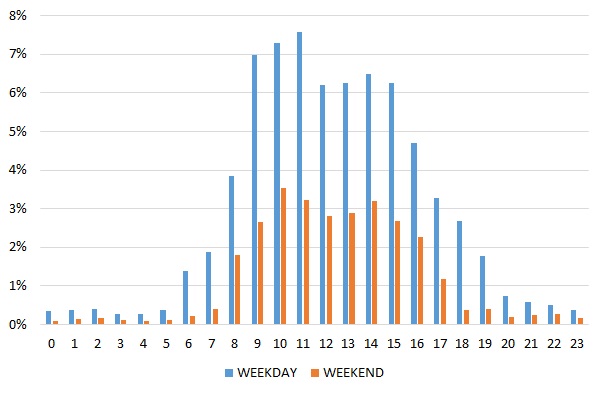
Total movements – percentage per hour by weekday/ weekend
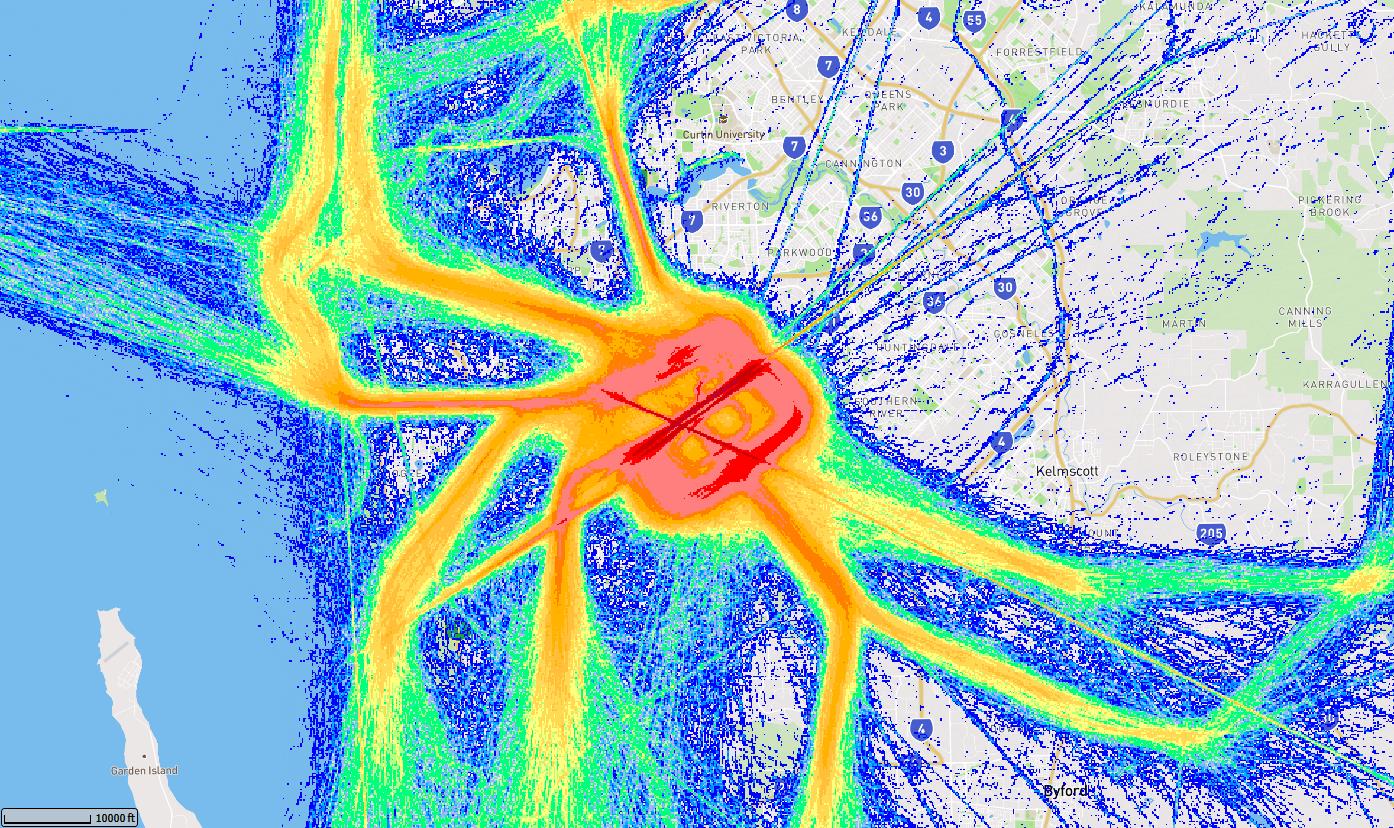
Track density
The following graph shows the density of movements over different suburbs in the quarter. This includes all arrival, departure and circuit movements.
The colours indicate the density of movements over the area. The hotter and deeper the colour, the more movements.
Click the image to enlarge it and return to this page by using the “Back” button in your browser.
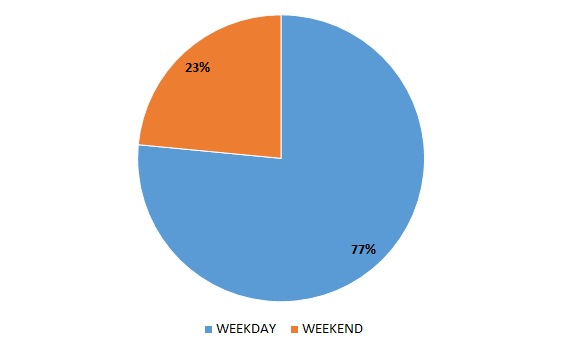
Total movements – percentage by weekday / weekend
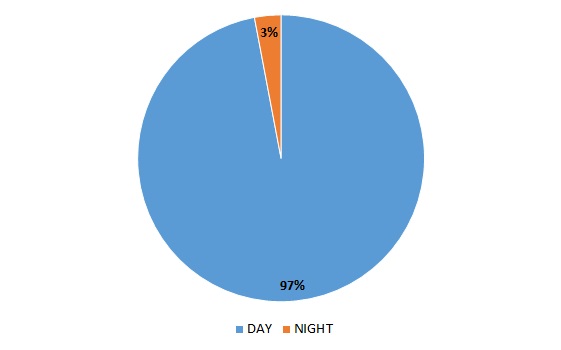
Total movements – percentage by day / night
“Day” is 6am to 11pm and “night” is 11pm to 6am.
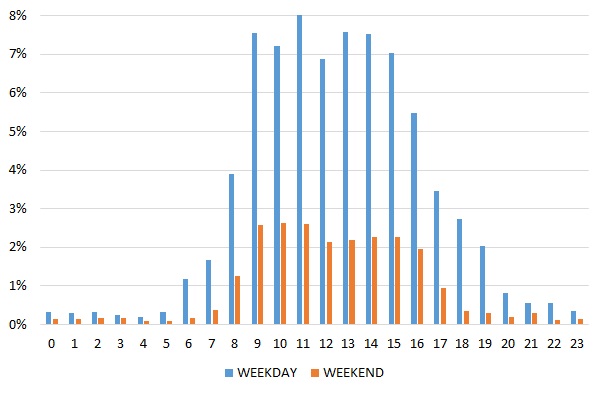
Total movements – percentage per hour by weekday/ weekend
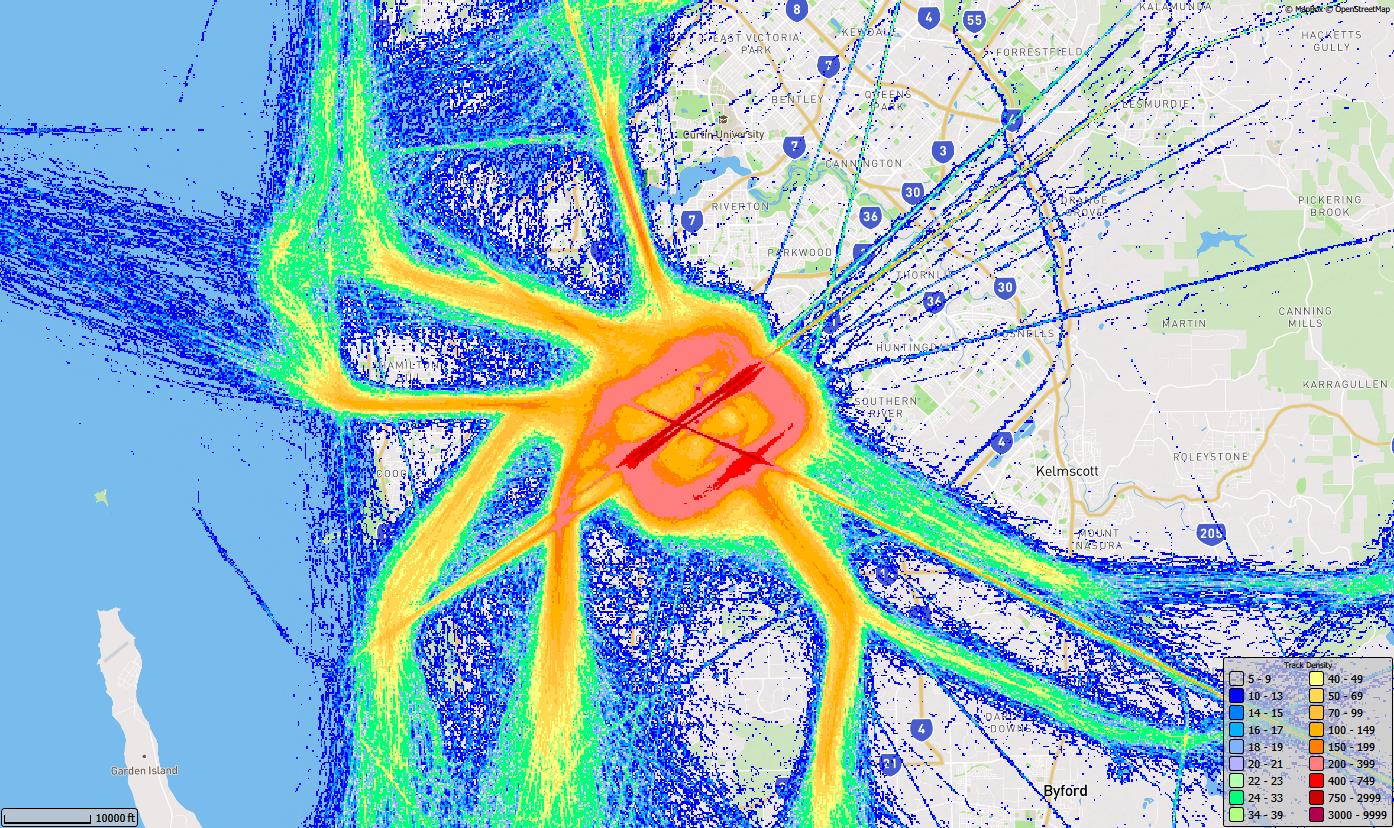
Track density
The following graph shows the density of movements over different suburbs in the quarter. This includes all arrival, departure and circuit movements.
The colours indicate the density of movements over the area. The hotter and deeper the colour, the more movements.
Click the image to enlarge it and return to this page by using the “Back” button in your browser.
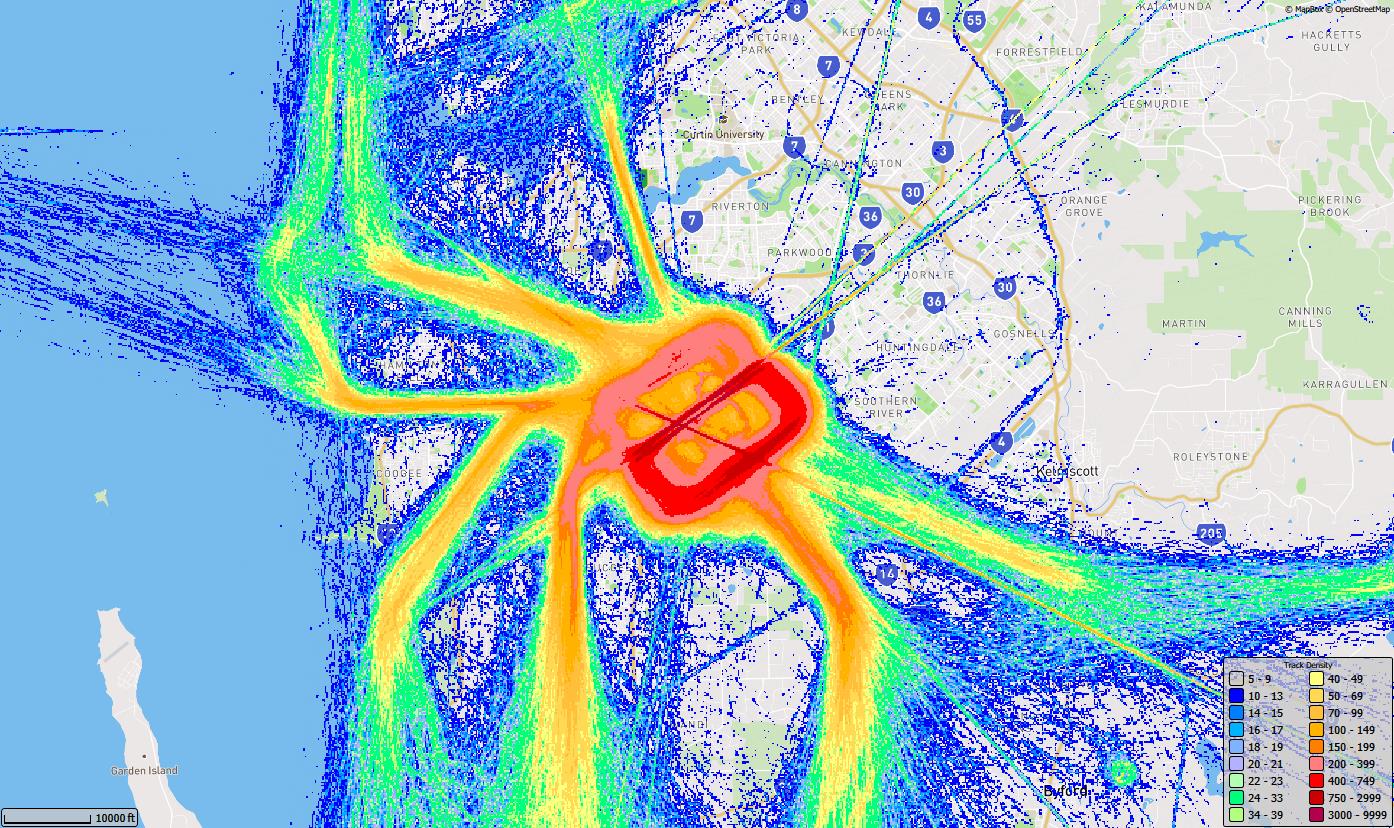
Total movements – percentage by weekday / weekend
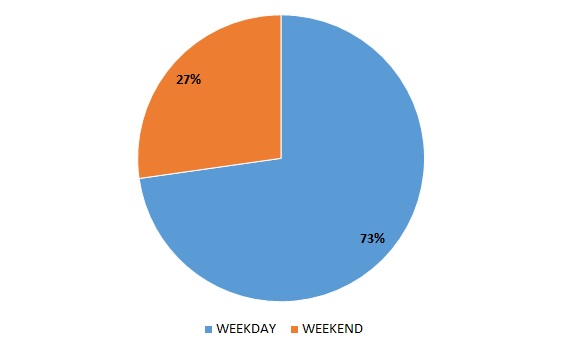
Total movements – percentage by day / night
“Day” is 6am to 11pm and “night” is 11pm to 6am.
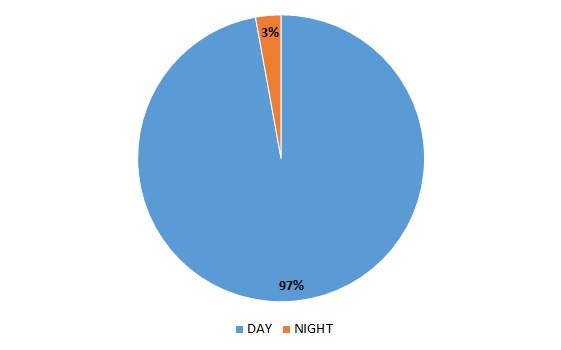
Total movements – percentage per hour by weekday/ weekend
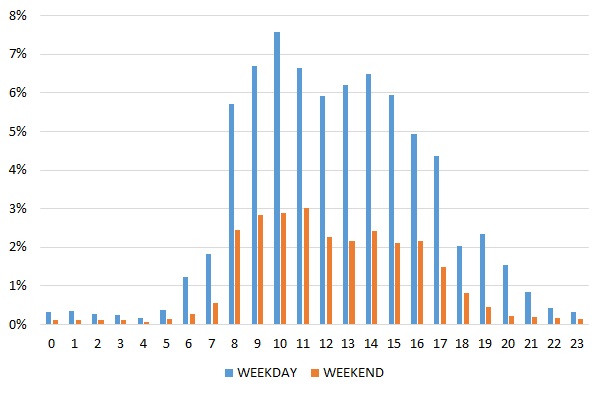
Track density
The following graph shows the density of movements over different suburbs in the quarter. This includes all arrival, departure and circuit movements.
The colours indicate the density of movements over the area. The hotter and deeper the colour, the more movements.
Click the image to enlarge it and return to this page by using the “Back” button in your browser.
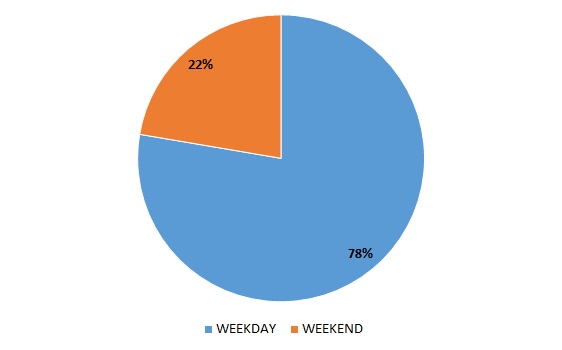
Total movements – percentage by weekday / weekend
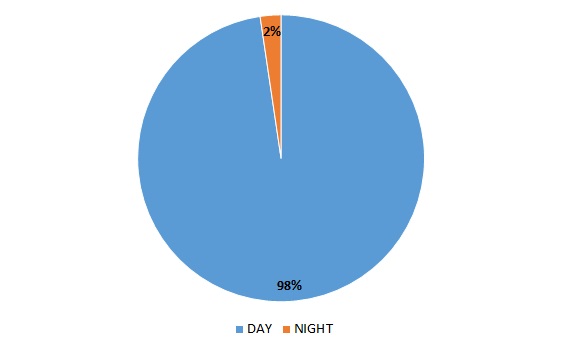
Total movements – percentage by day / night
“Day” is 6am to 11pm and “night” is 11pm to 6am.
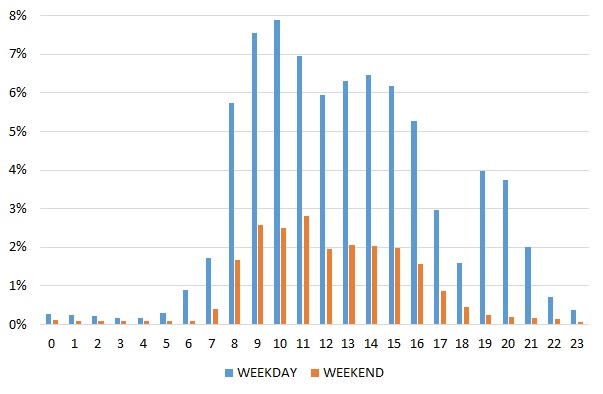
Total movements – percentage per hour by weekday/ weekend
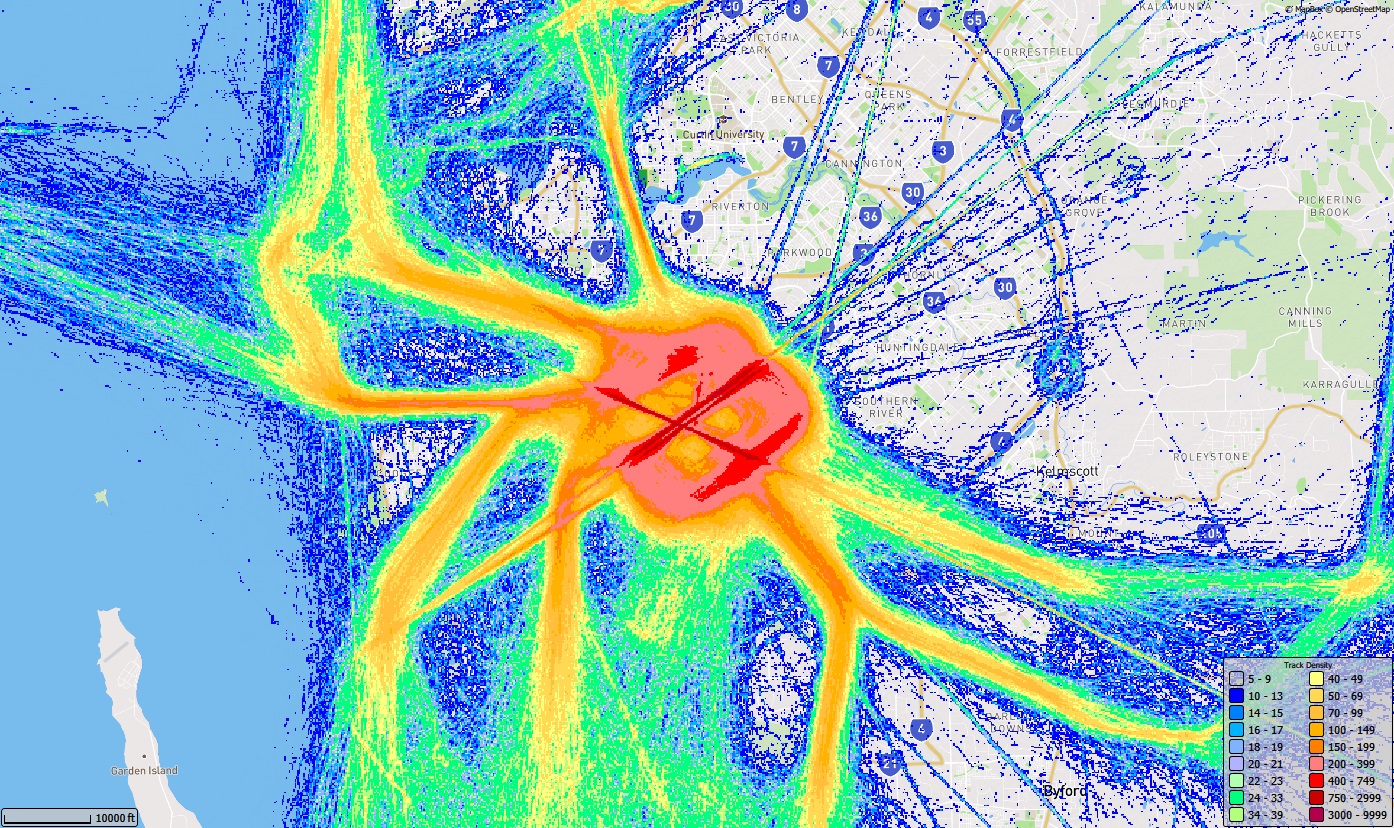
Track density
The following graph shows the density of movements over different suburbs in the quarter. This includes all arrival, departure and circuit movements.
The colours indicate the density of movements over the area. The hotter and deeper the colour, the more movements.
Click the image to enlarge it and return to this page by using the “Back” button in your browser.
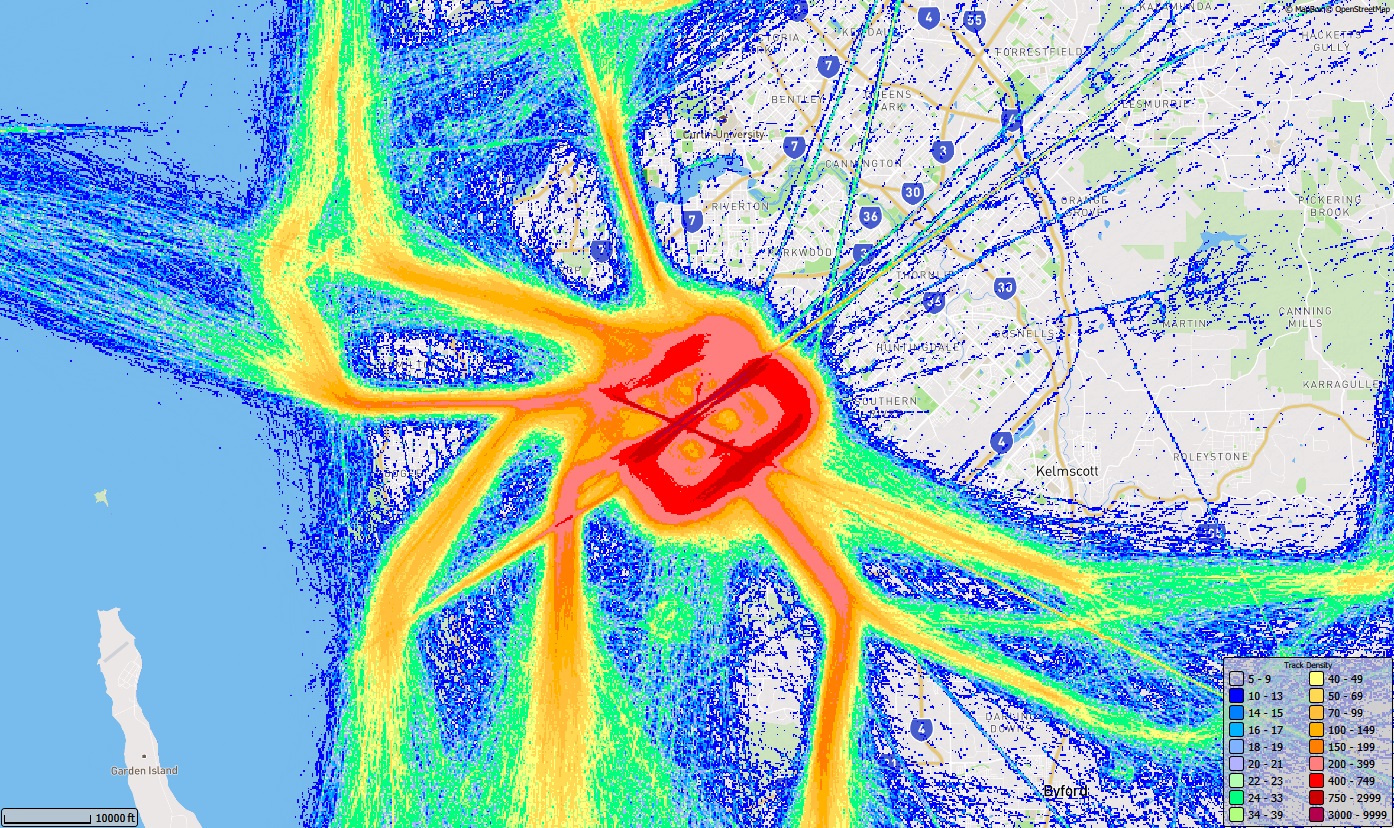
Total movements – percentage by weekday / weekend
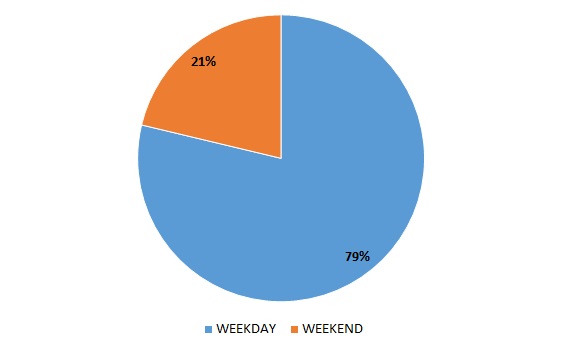
Total movements – percentage by day / night
“Day” is 6am to 11pm and “night” is 11pm to 6am.
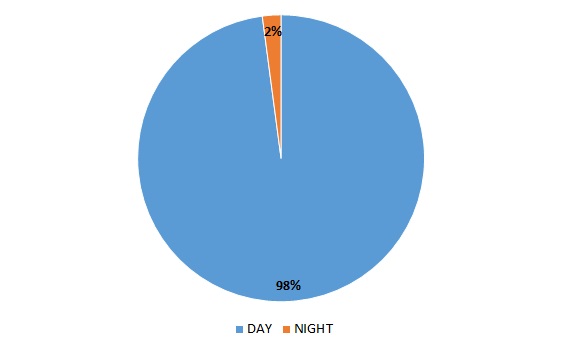
Total movements – percentage per hour by weekday/ weekend
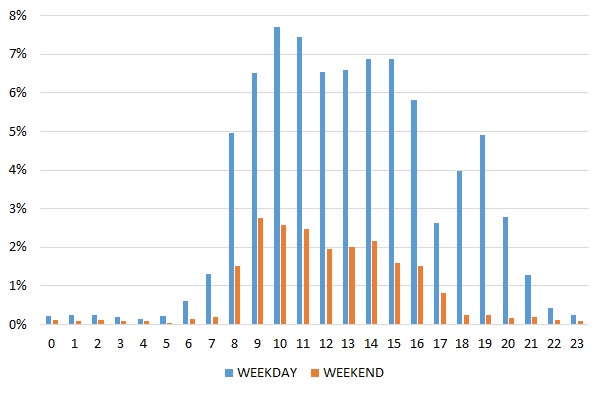
Track density
The following graph shows the density of movements over different suburbs in the quarter. This includes all arrival, departure and circuit movements.
The colours indicate the density of movements over the area. The hotter and deeper the colour, the more movements.
Click the image to enlarge it and return to this page by using the “Back” button in your browser.
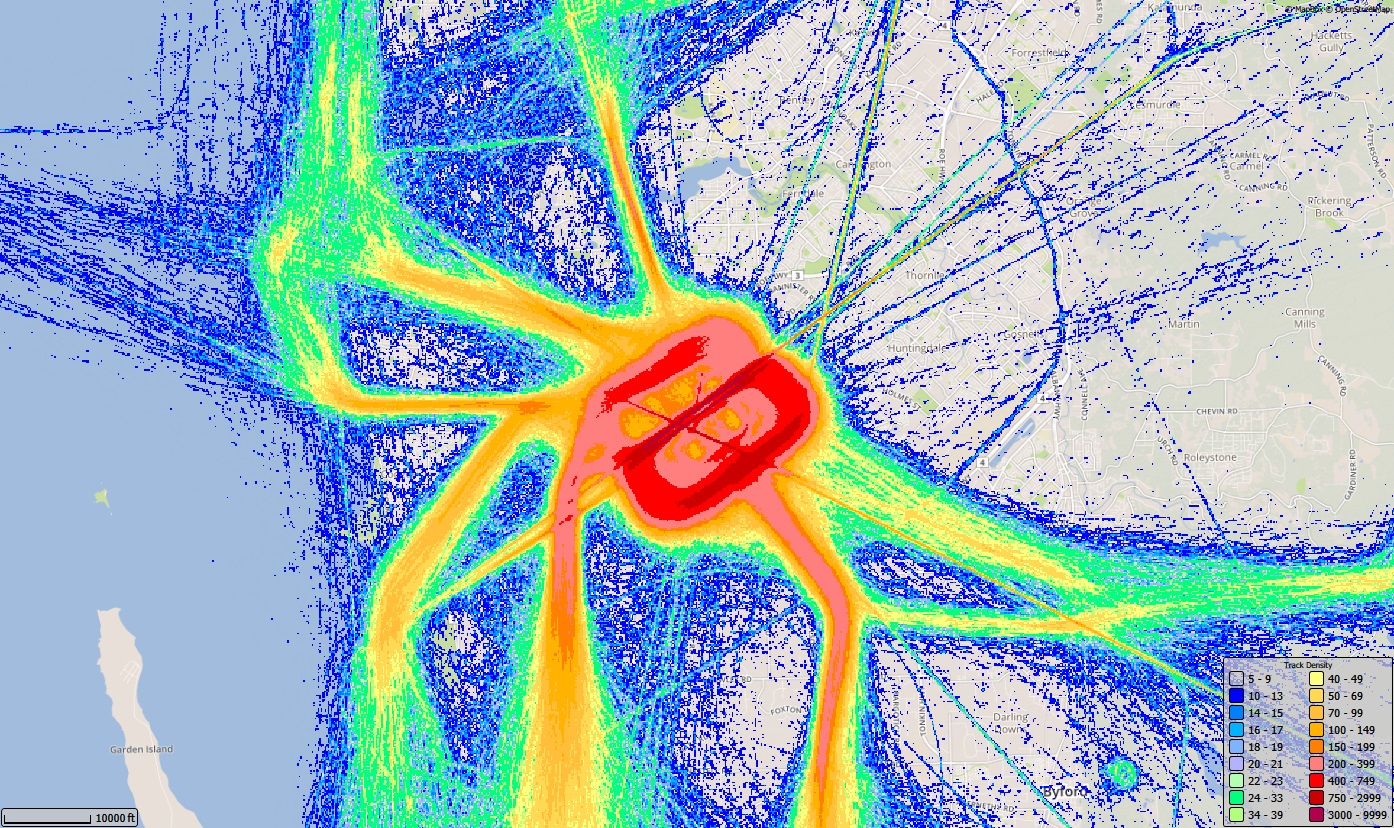
Total movements – percentage by weekday / weekend
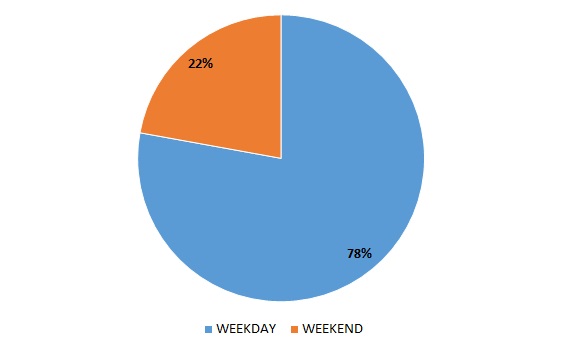
Total movements – percentage by day / night
“Day” is 6am to 11pm and “night” is 11pm to 6am.
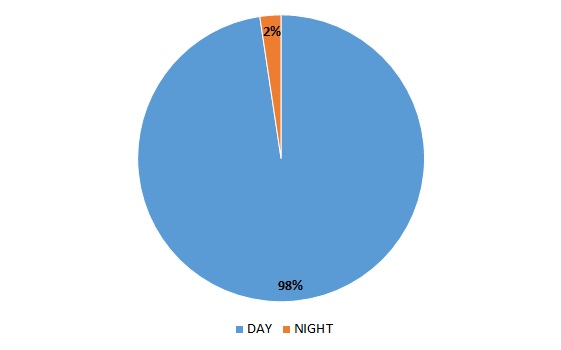
Total movements – percentage per hour by weekday/ weekend
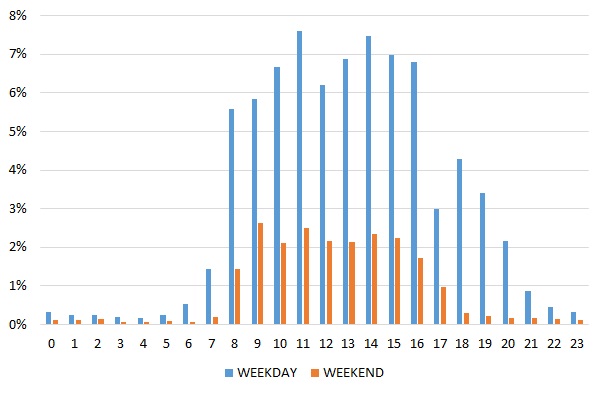
Track density
The following graph shows the density of movements over different suburbs in the quarter. This includes all arrival, departure and circuit movements.
The colours indicate the density of movements over the area. The hotter and deeper the colour, the more movements.
Click the image to enlarge it and return to this page by using the “Back” button in your browser.
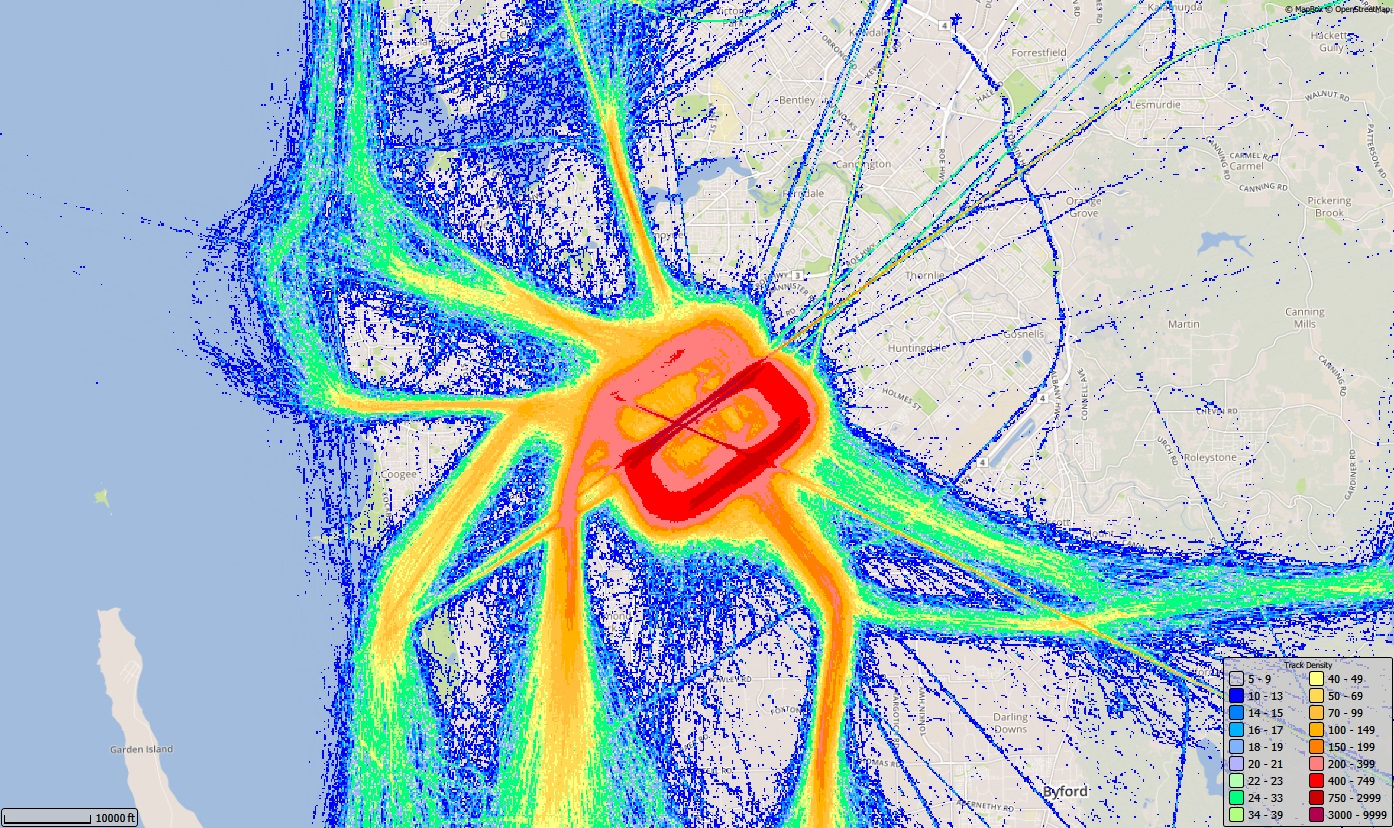
Total movements – percentage by weekday / weekend
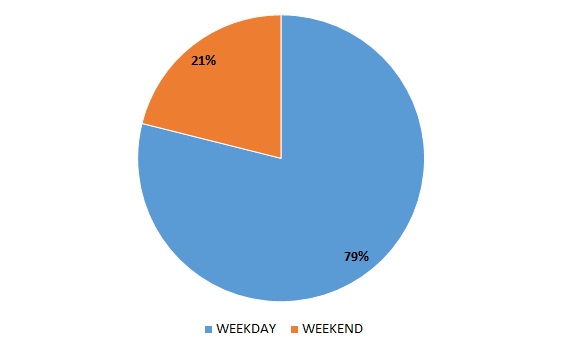
Total movements – percentage by day / night
“Day” is 6am to 11pm and “night” is 11pm to 6am.
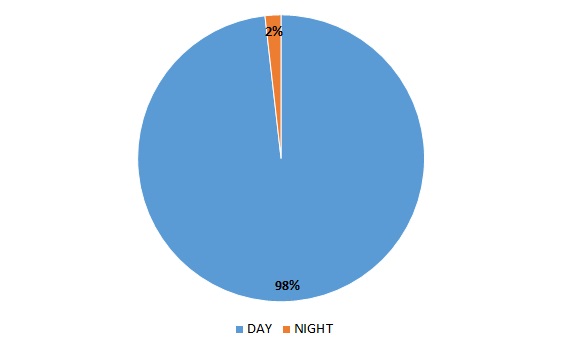
Total movements – percentage per hour by weekday/ weekend
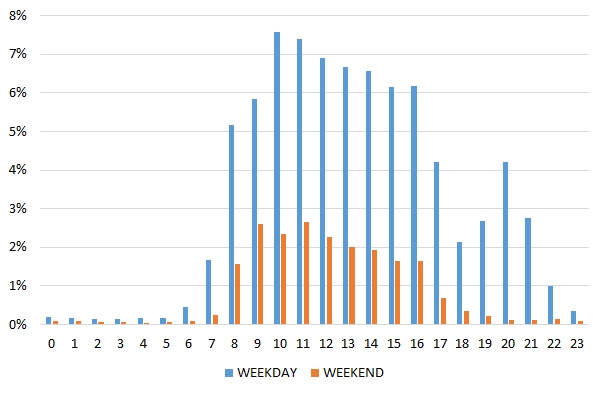
Track density
The following graph shows the density of movements over different suburbs in the quarter. This includes all arrival, departure and circuit movements.
The colours indicate the density of movements over the area. The hotter and deeper the colour, the more movements.
Click the image to enlarge it and return to this page by using the “Back” button in your browser.
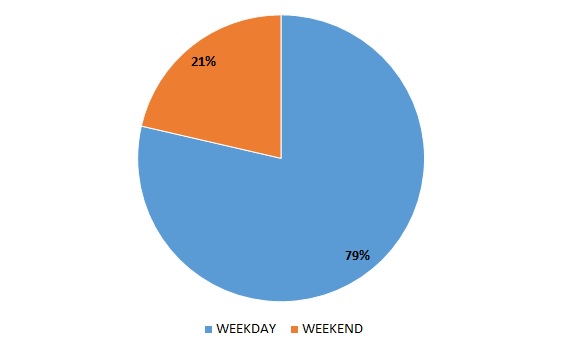
Total movements – percentage by weekday / weekend
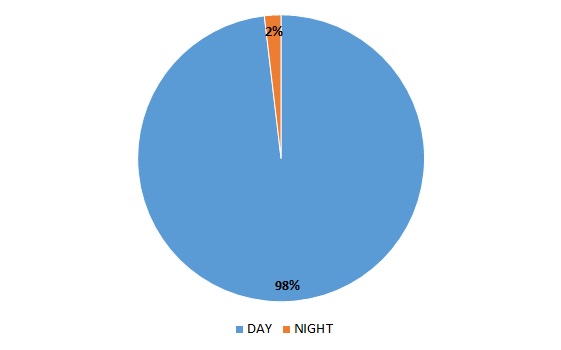
Total movements – percentage by day / night
“Day” is 6am to 11pm and “night” is 11pm to 6am.
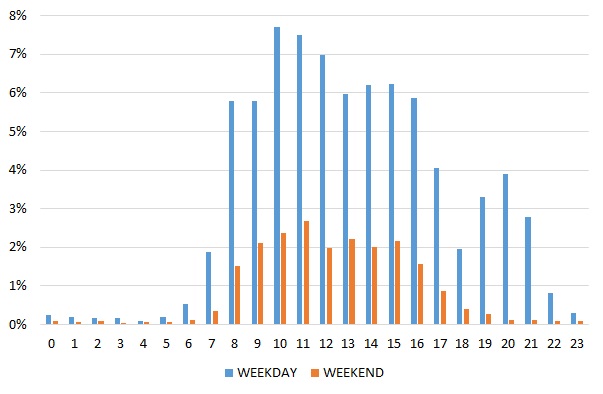
Total movements – percentage per hour by weekday/ weekend
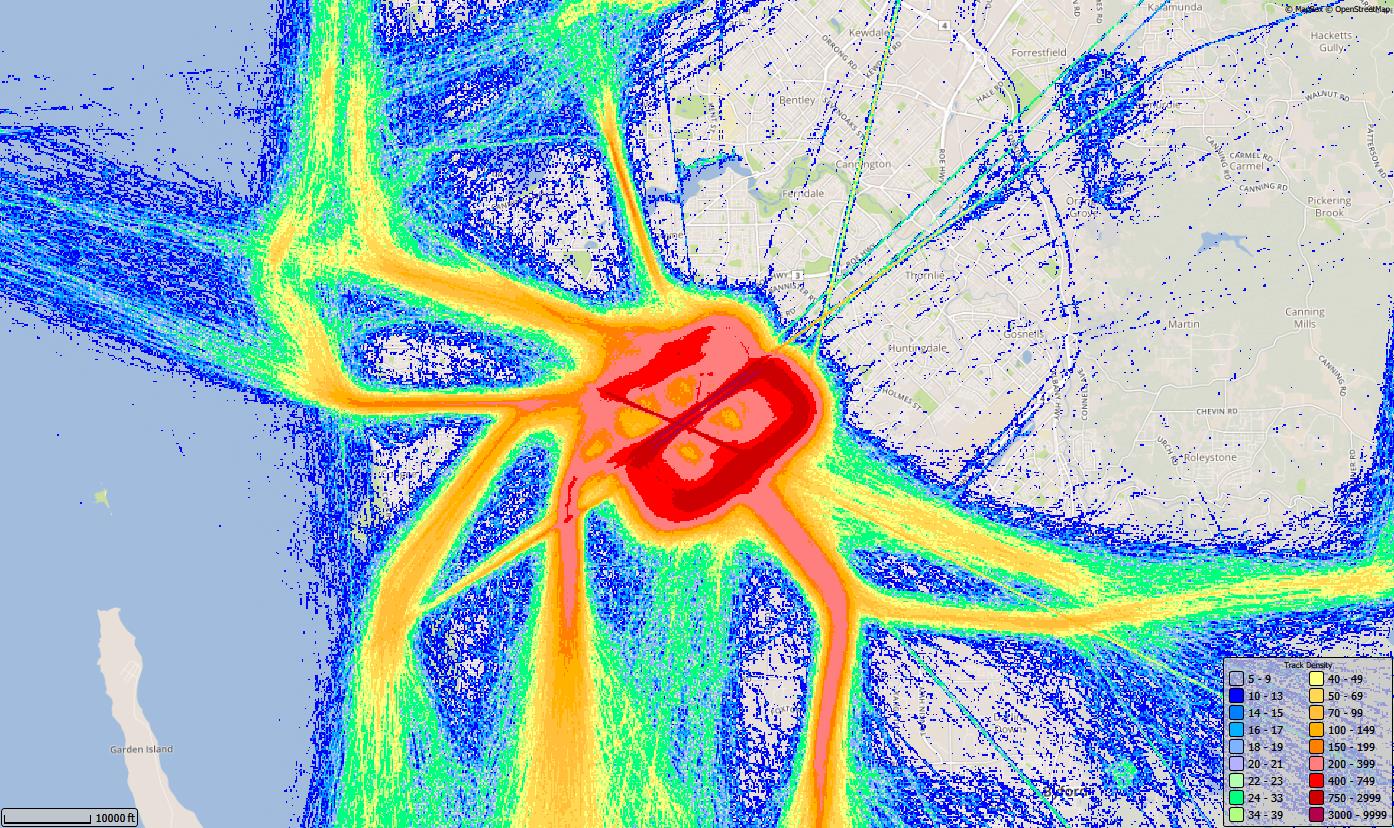
Track density
The following graph shows the density of movements over different suburbs in the quarter. This includes all arrival, departure and circuit movements.
The colours indicate the density of movements over the area. The hotter and deeper the colour, the more movements.
Click the image to enlarge it and return to this page by using the “Back” button in your browser.
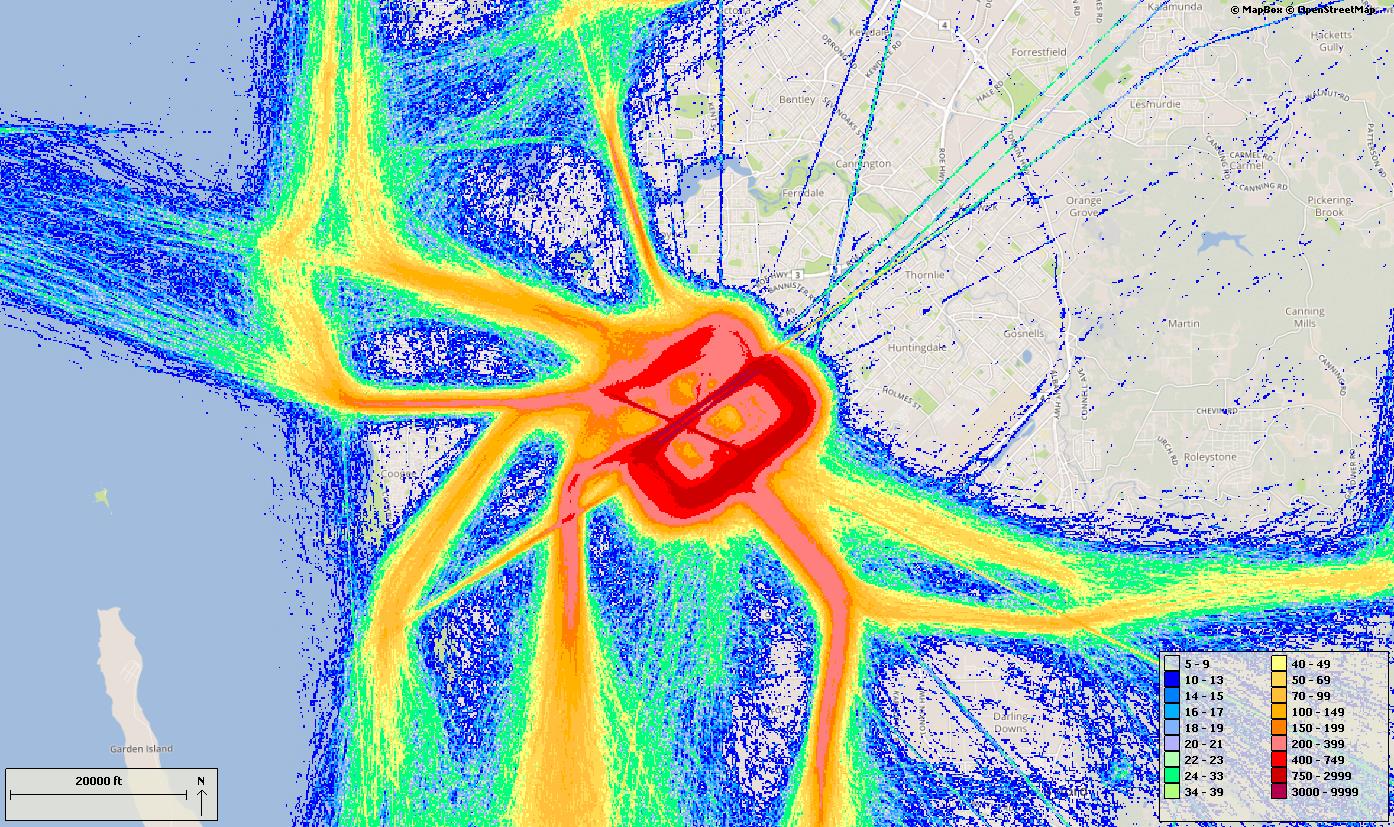
Total movements – percentage by weekday / weekend
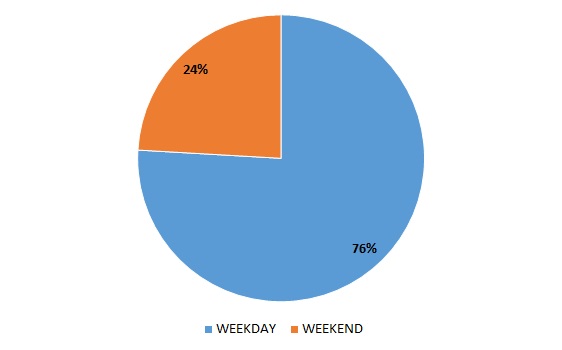
Total movements – percentage by day / night
“Day” is 6am to 11pm and “night” is 11pm to 6am.
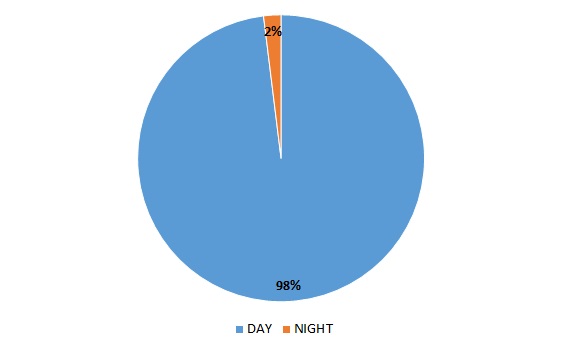
Total movements – percentage per hour by weekday/ weekend
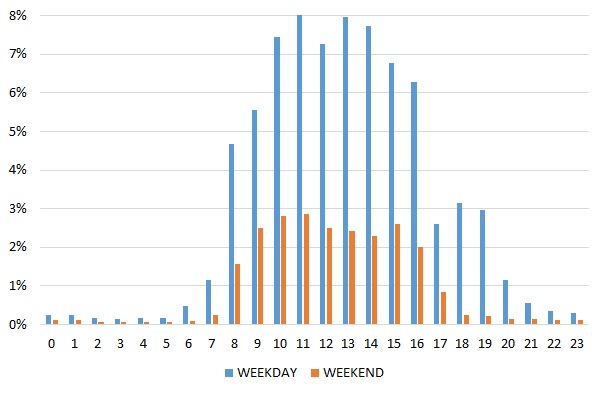
Track density
The following graph shows the density of movements over different suburbs in the quarter. This includes all arrival, departure and circuit movements.
The colours indicate the density of movements over the area. The hotter and deeper the colour, the more movements.
Click the image to enlarge it and return to this page by using the “Back” button in your browser.
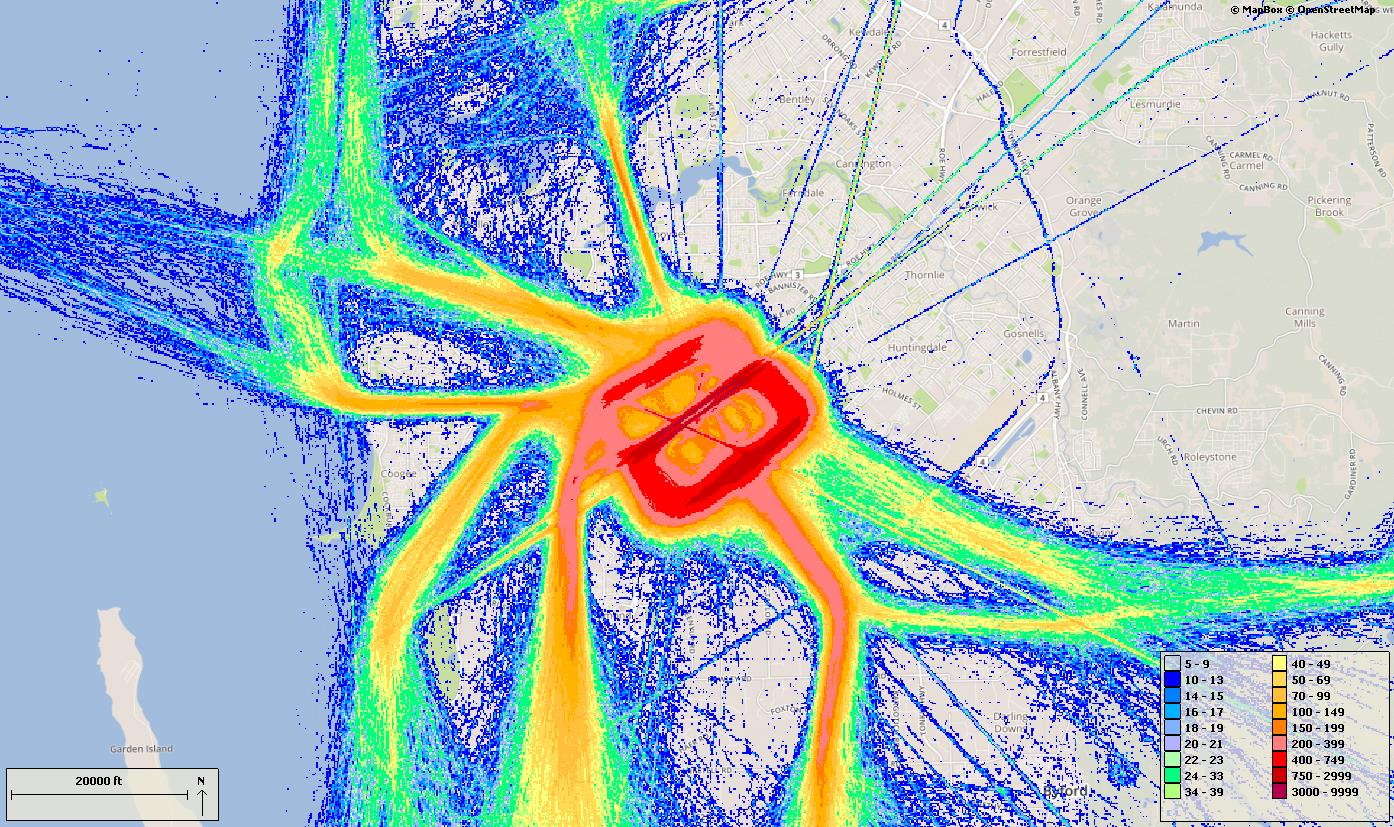
Total movements – percentage by weekday / weekend
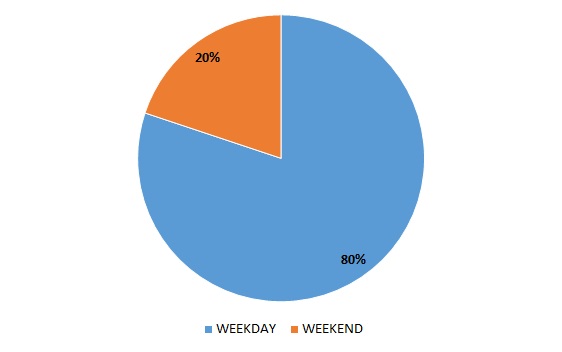
Total movements – percentage by day / night
“Day” is 6am to 11pm and “night” is 11pm to 6am.
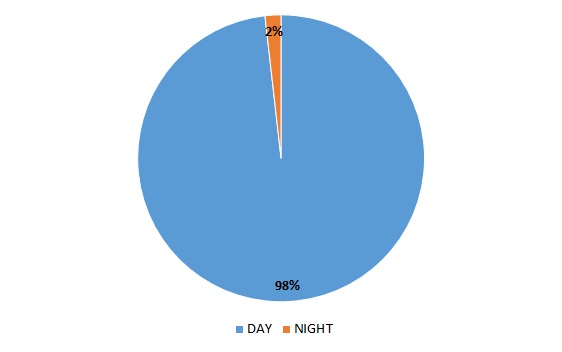
Total movements – percentage per hour by weekday/ weekend
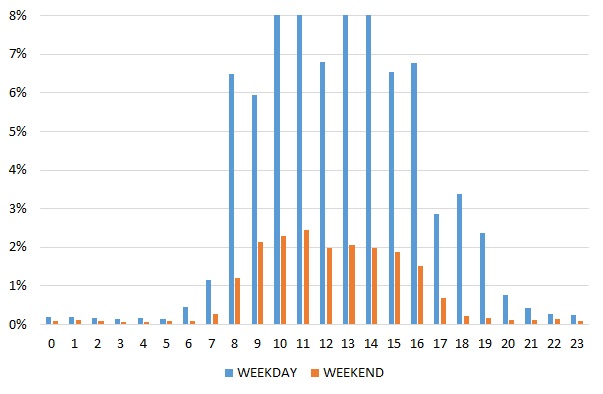
Track density
The following graph shows the density of movements over different suburbs in the quarter. This includes all arrival, departure and circuit movements.
The colours indicate the density of movements over the area. The hotter and deeper the colour, the more movements.
Click the image to enlarge it and return to this page by using the “Back” button in your browser.
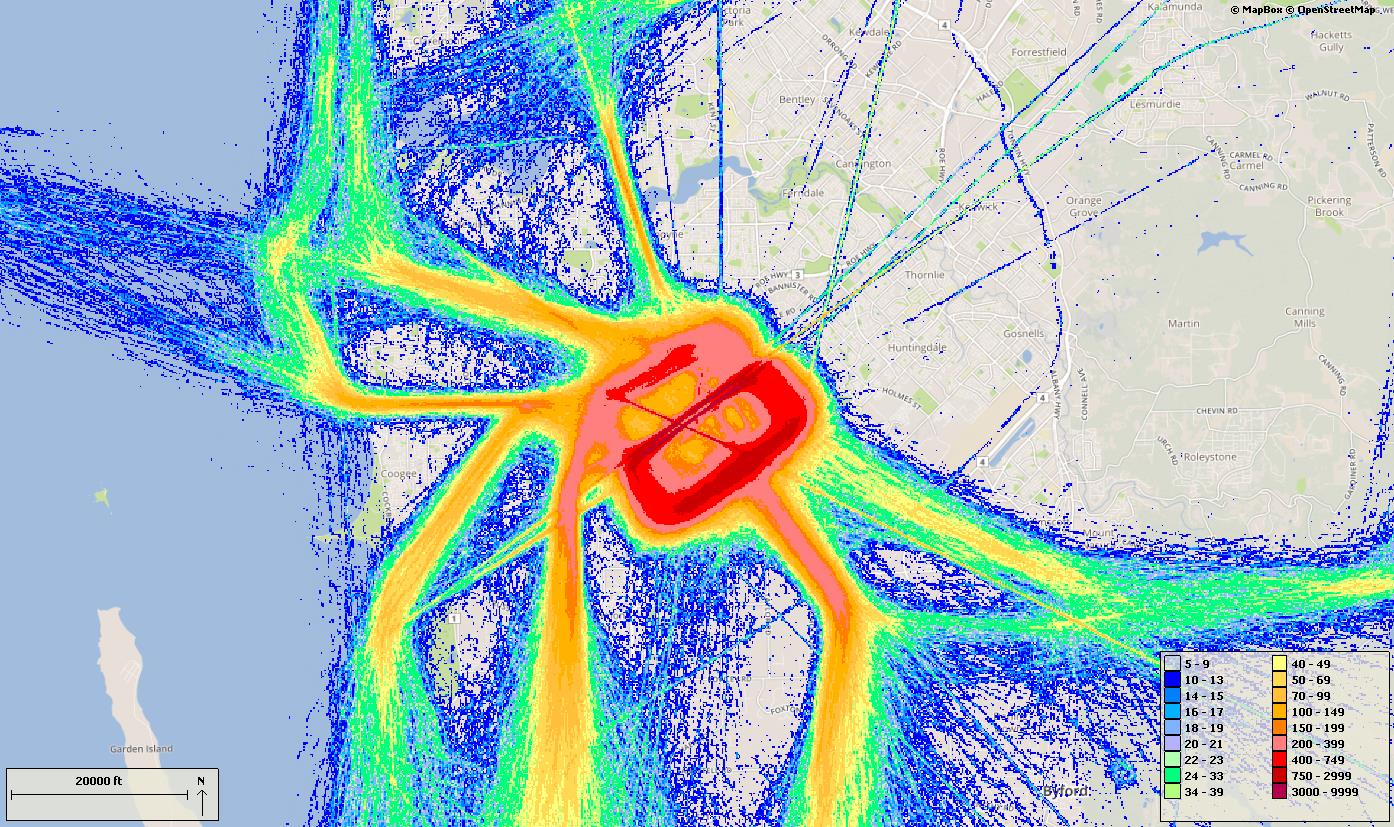
Total movements – percentage by weekday / weekend
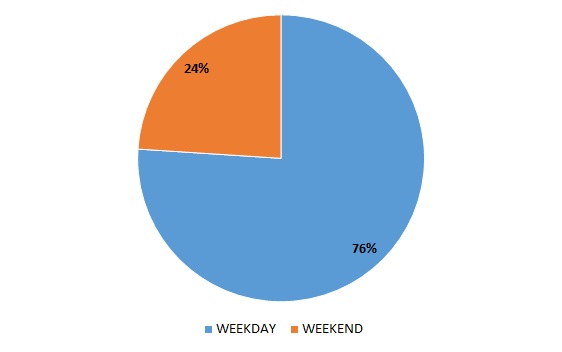
Total movements – percentage by day / night
“Day” is 6am to 11pm and “night” is 11pm to 6am.
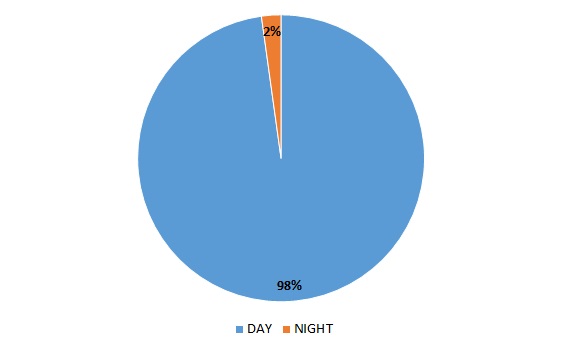
Total movements – percentage per hour by weekday/ weekend
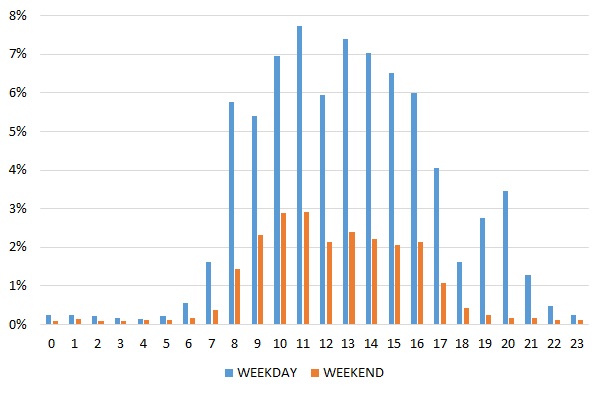
Track density
The following graph shows the density of movements over different suburbs in the quarter. This includes all arrival, departure and circuit movements.
The colours indicate the density of movements over the area. The hotter and deeper the colour, the more movements.
Click the image to enlarge it and return to this page by using the “Back” button in your browser.
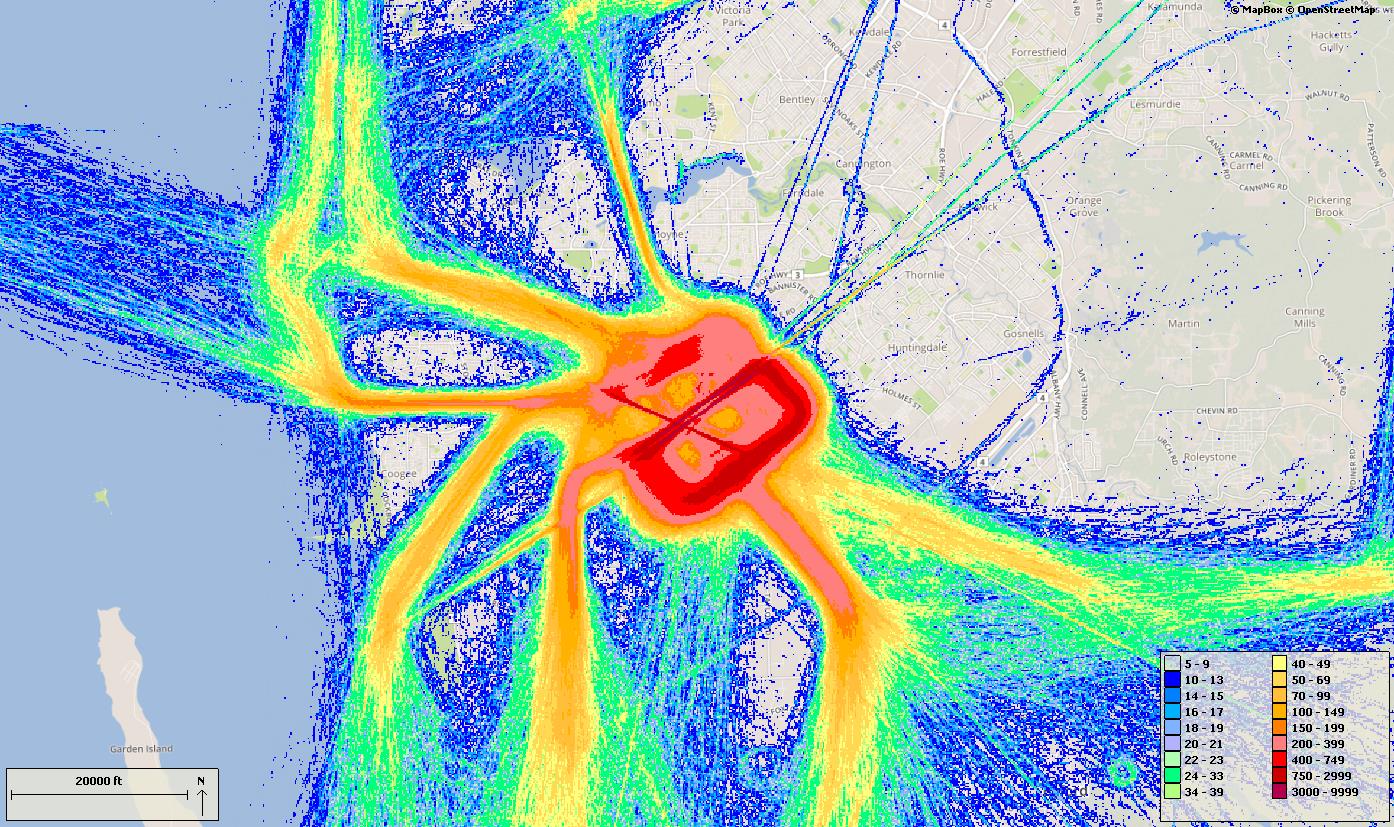
Total movements – percentage by weekday / weekend
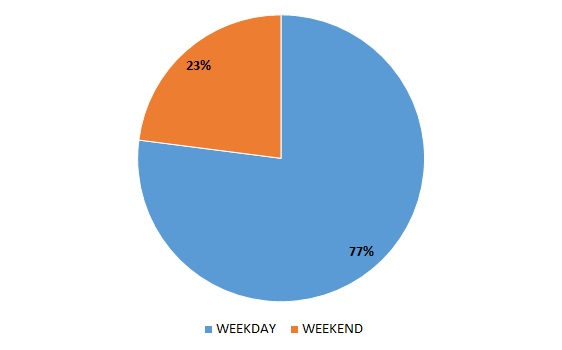
Total movements – percentage by day / night
“Day” is 6am to 11pm and “night” is 11pm to 6am.
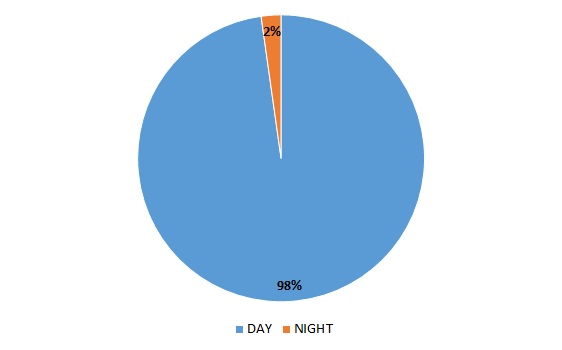
Total movements – percentage per hour by weekday/ weekend
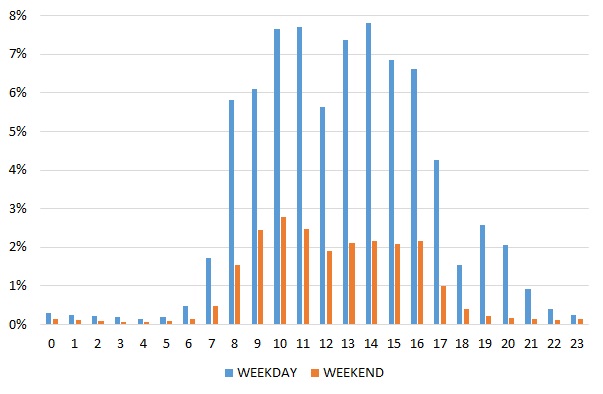
Track density
The following graph shows the density of movements over different suburbs in the quarter. This includes all arrival, departure and circuit movements.
The colours indicate the density of movements over the area. The hotter and deeper the colour, the more movements.
Click the image to enlarge it and return to this page by using the “Back” button in your browser.
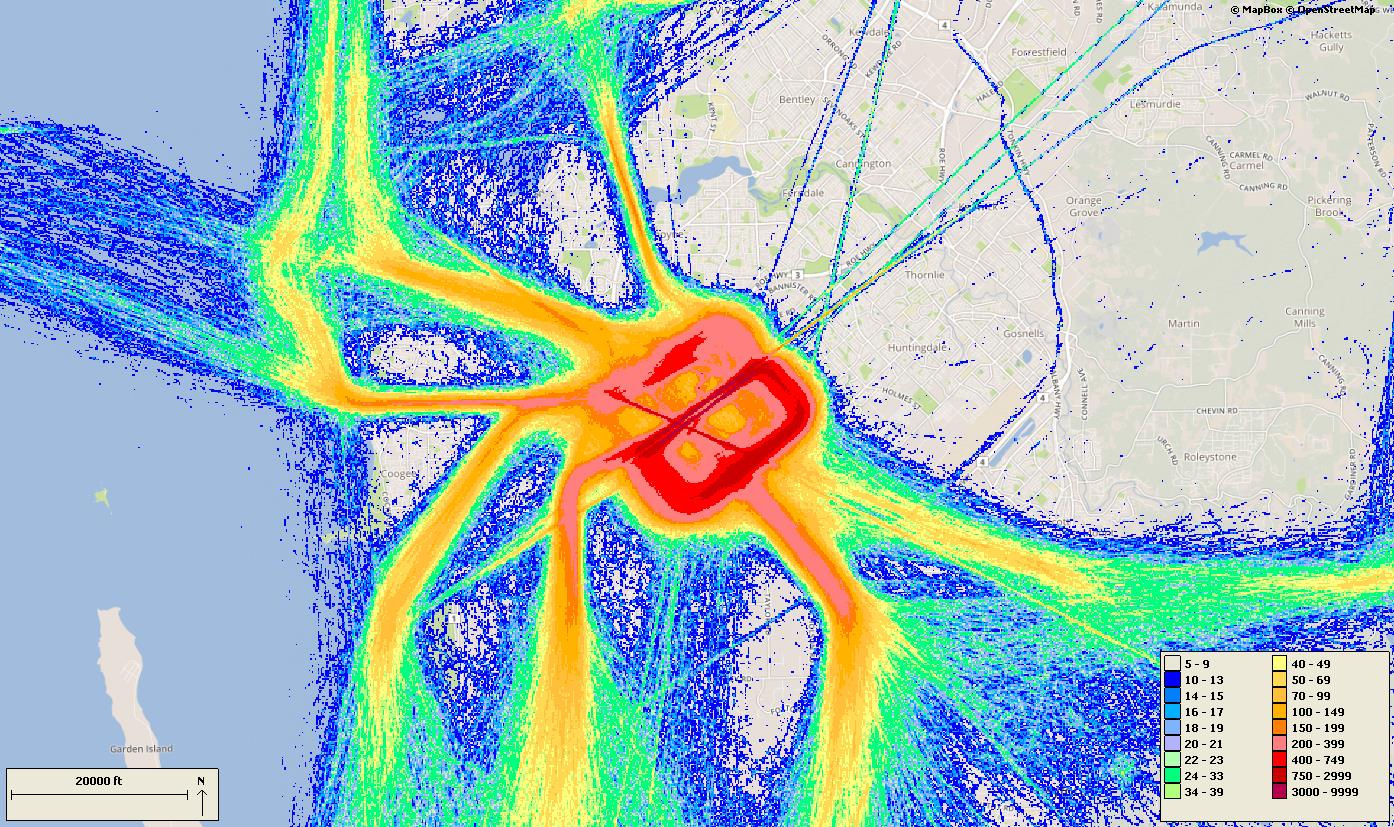
Total movements – percentage by weekday / weekend
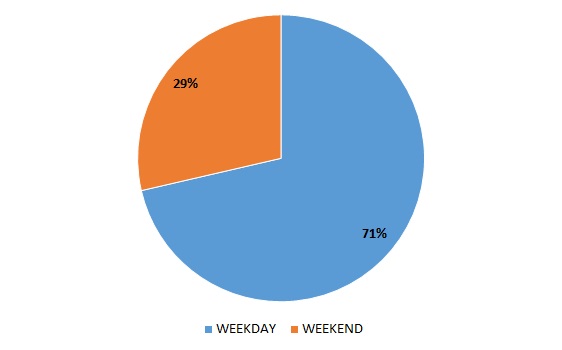
Total movements – percentage by day / night
“Day” is 6am to 11pm and “night” is 11pm to 6am.
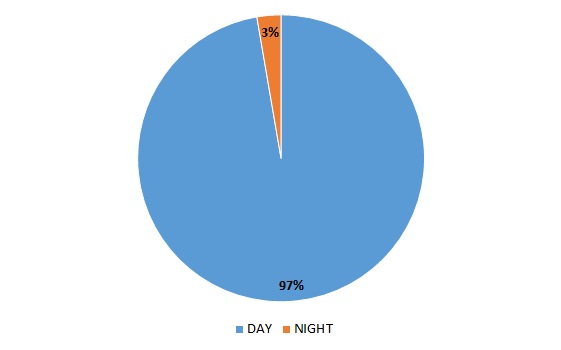
Total movements – percentage per hour by weekday/ weekend
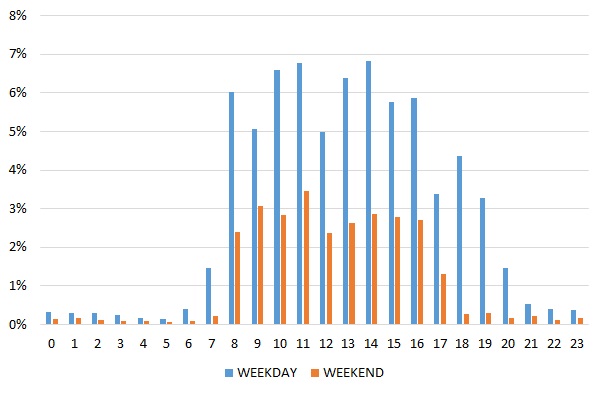
Track density
The following graph shows the density of movements over different suburbs in the quarter. This includes all arrival, departure and circuit movements.
The colours indicate the density of movements over the area. The hotter and deeper the colour, the more movements.
Click the image to enlarge it and return to this page by using the “Back” button in your browser.
Total movements – percentage by weekday / weekend
Total movements – percentage by day / night
“Day” is 6am to 11pm and “night” is 11pm to 6am.
Total movements – percentage per hour by weekday/ weekend
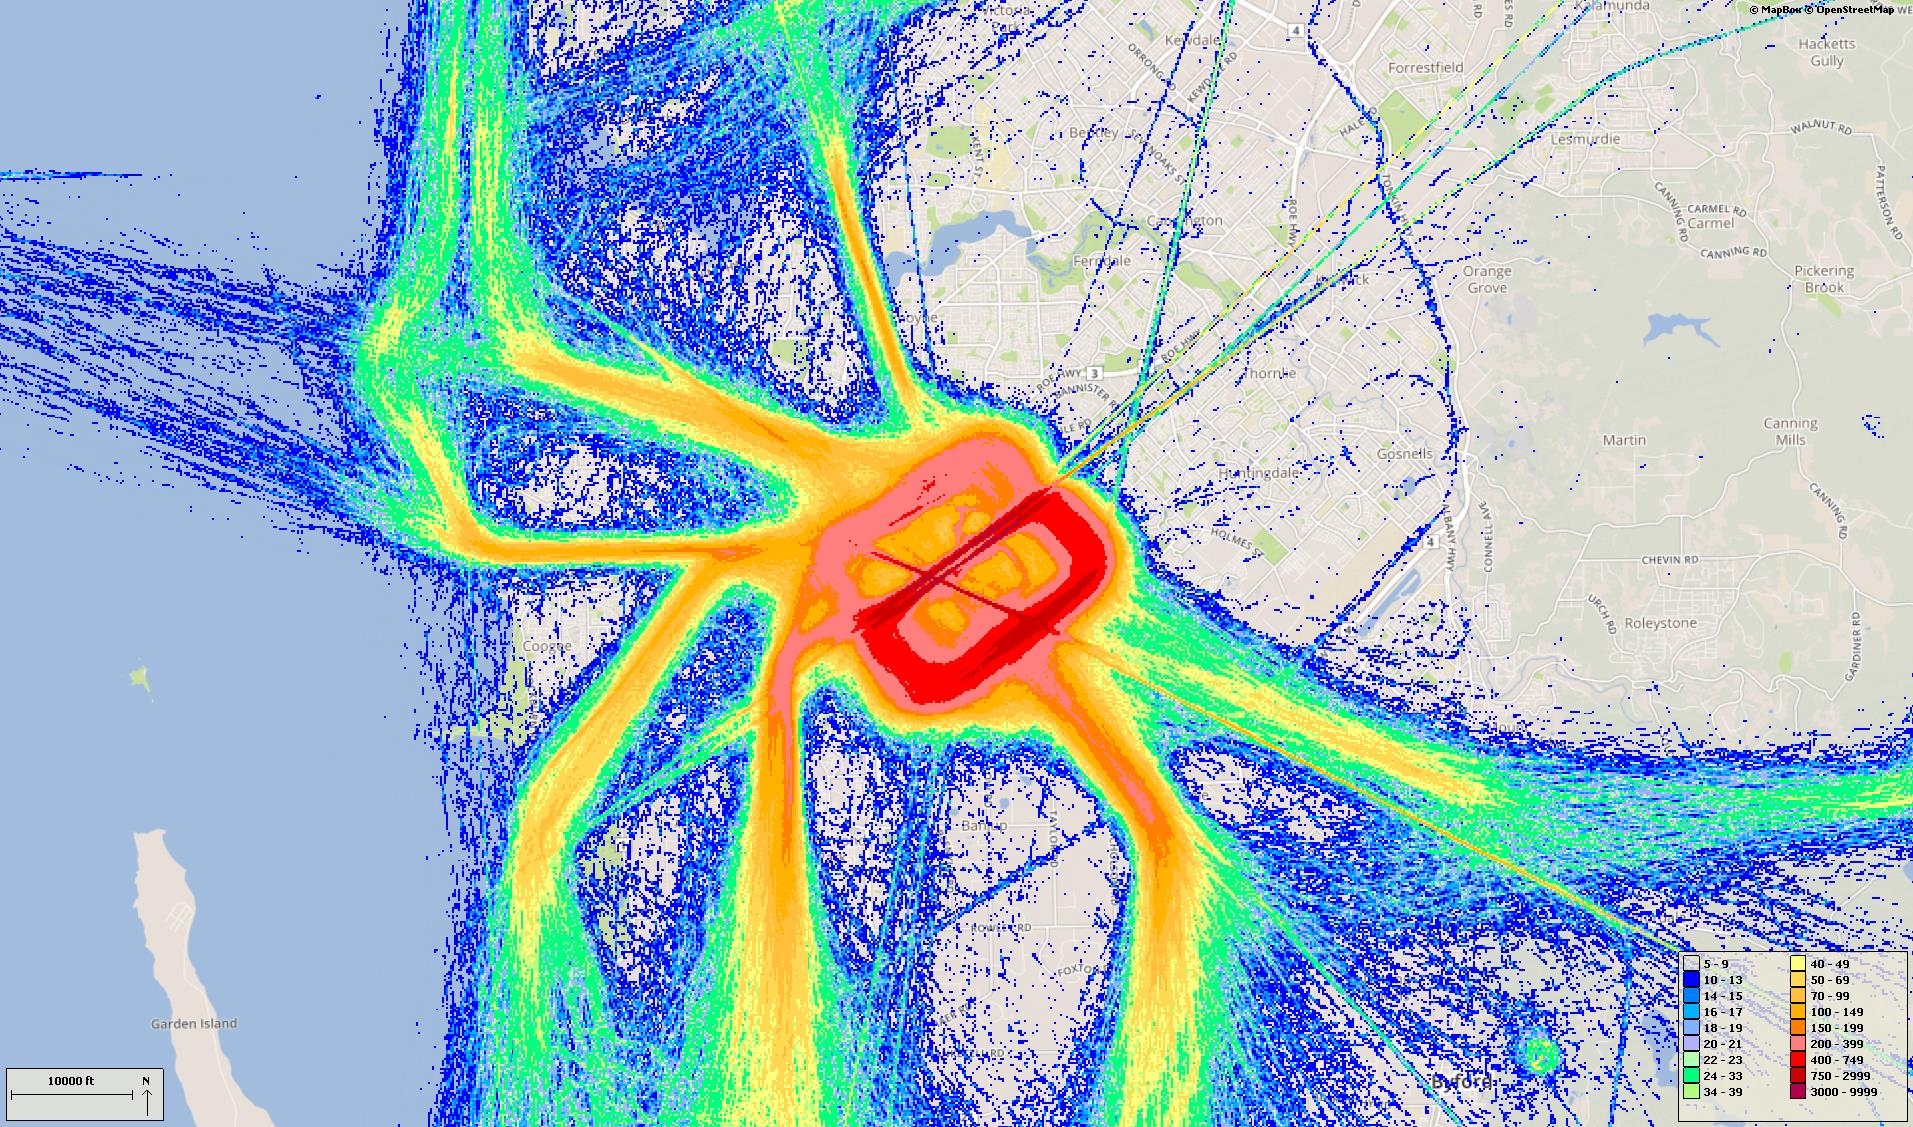
Track density
The following graph shows the density of movements over different suburbs in the quarter. This includes all arrival, departure and circuit movements.
The colours indicate the density of movements over the area. The hotter and deeper the colour, the more movements.
Click the image to enlarge it and return to this page by using the “Back” button in your browser.
Total movements – percentage by weekday / weekend
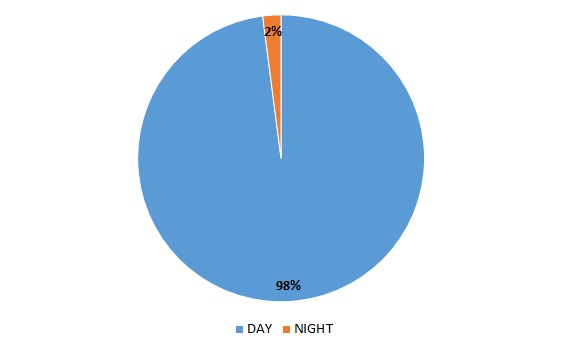
Total movements – percentage by day / night
“Day” is 6am to 11pm and “night” is 11pm to 6am.
Total movements – percentage per hour by weekday/ weekend
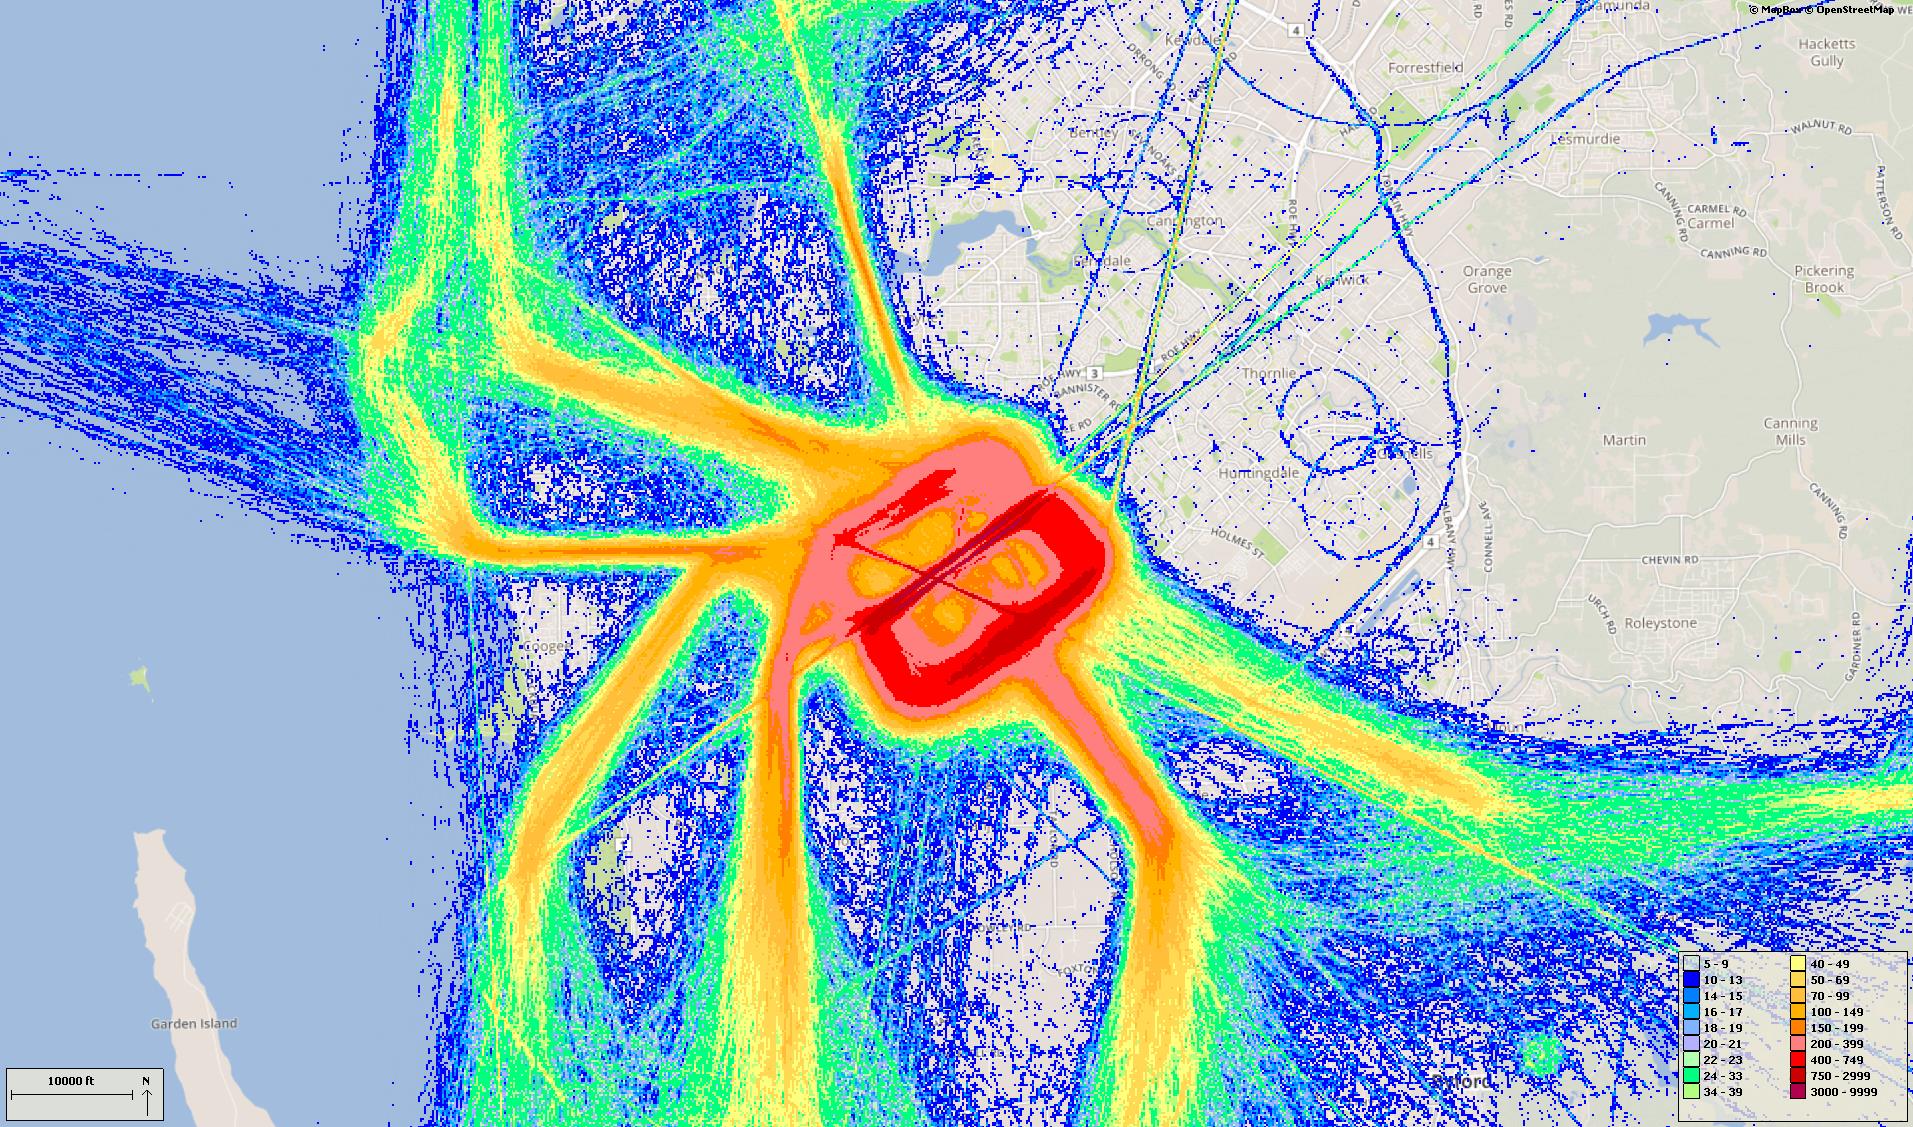
Track density
The following graph shows the density of movements over different suburbs in the quarter. This includes all arrival, departure and circuit movements.
The colours indicate the density of movements over the area. The hotter and deeper the colour, the more movements.
Click the image to enlarge it and return to this page by using the “Back” button in your browser.
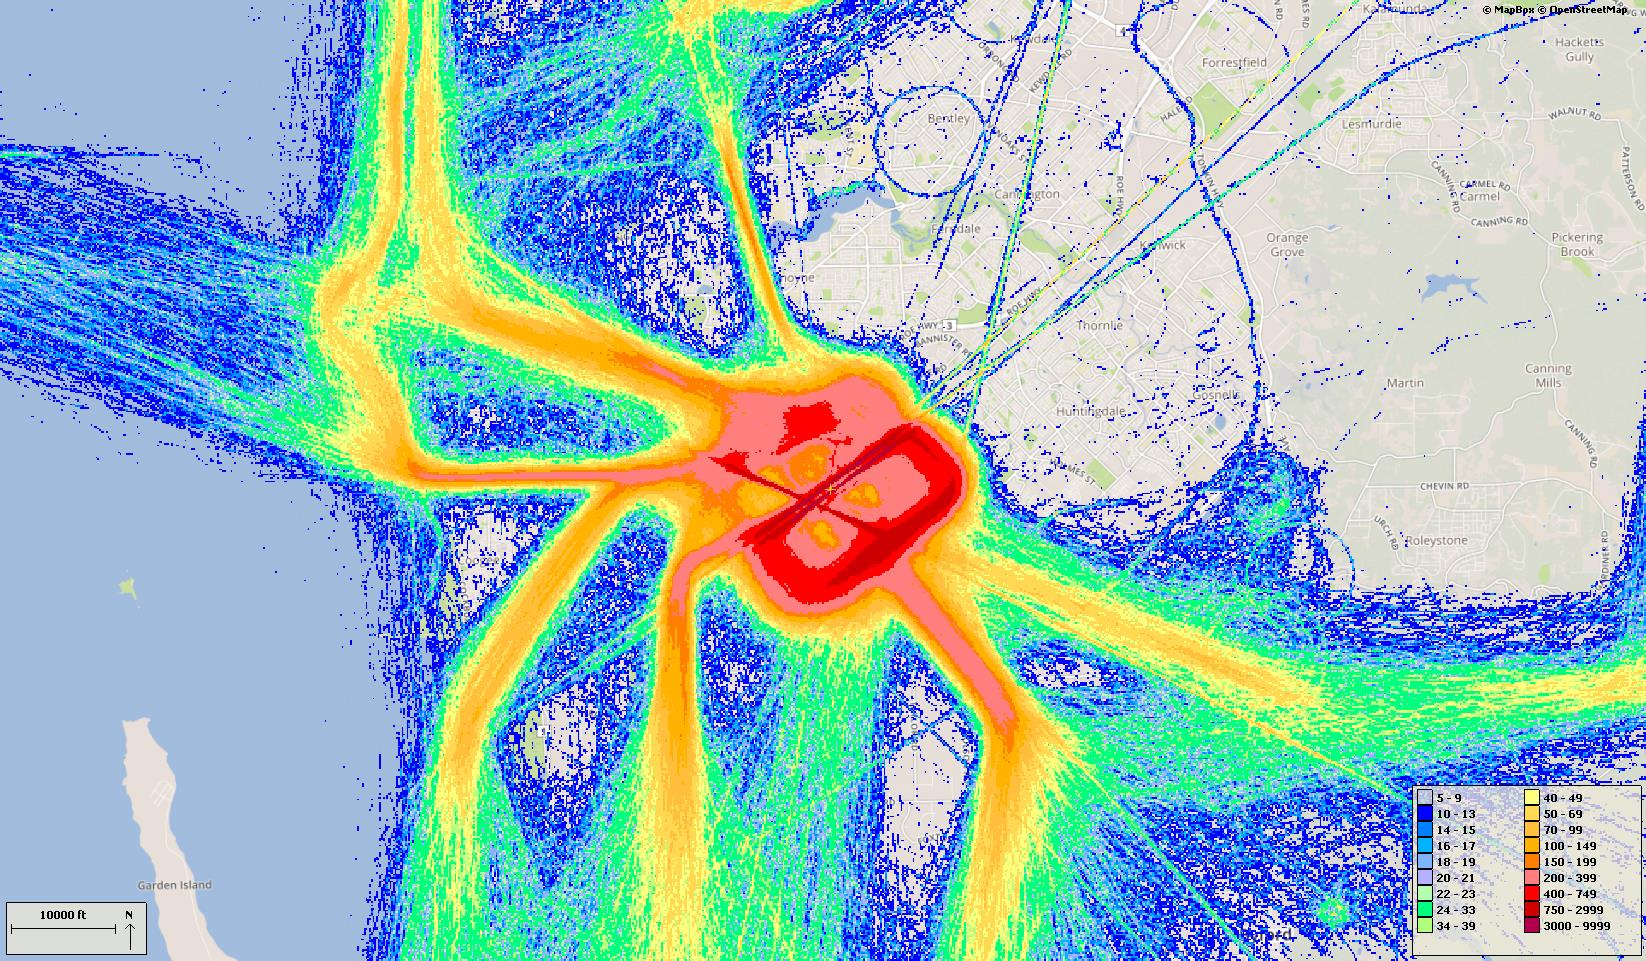
Total movements – percentage by weekday / weekend
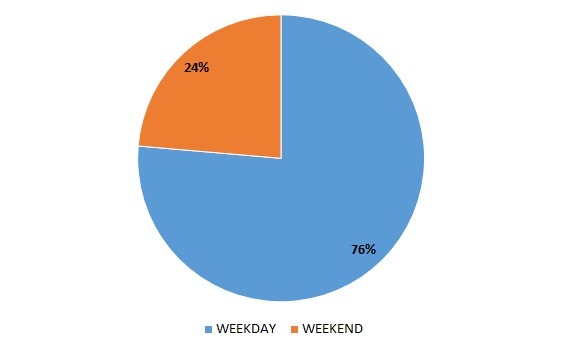
Total movements – percentage by day / night
“Day” is 6am to 11pm and “night” is 11pm to 6am.
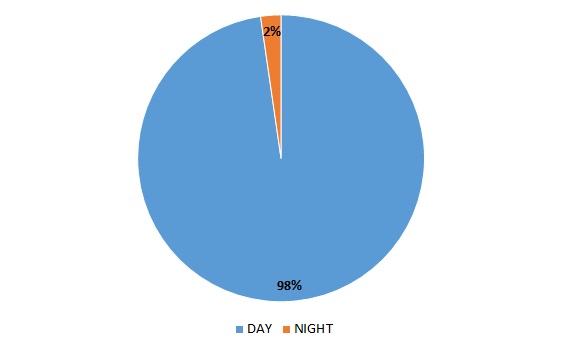
Total movements – percentage per hour by weekday/ weekend
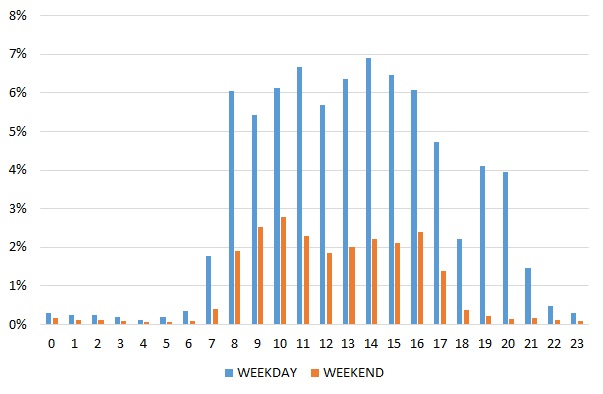
Track density
The following graph shows the density of movements over different suburbs in the quarter. This includes all arrival, departure and circuit movements.
The colours indicate the density of movements over the area. The hotter and deeper the colour, the more movements.
Click the image to enlarge it and return to this page by using the “Back” button in your browser.
Total movements – percentage by weekday / weekend
Total movements – percentage by day / night
“Day” is 6am to 11pm and “night” is 11pm to 6am.
Total movements – percentage per hour by weekday/ weekend
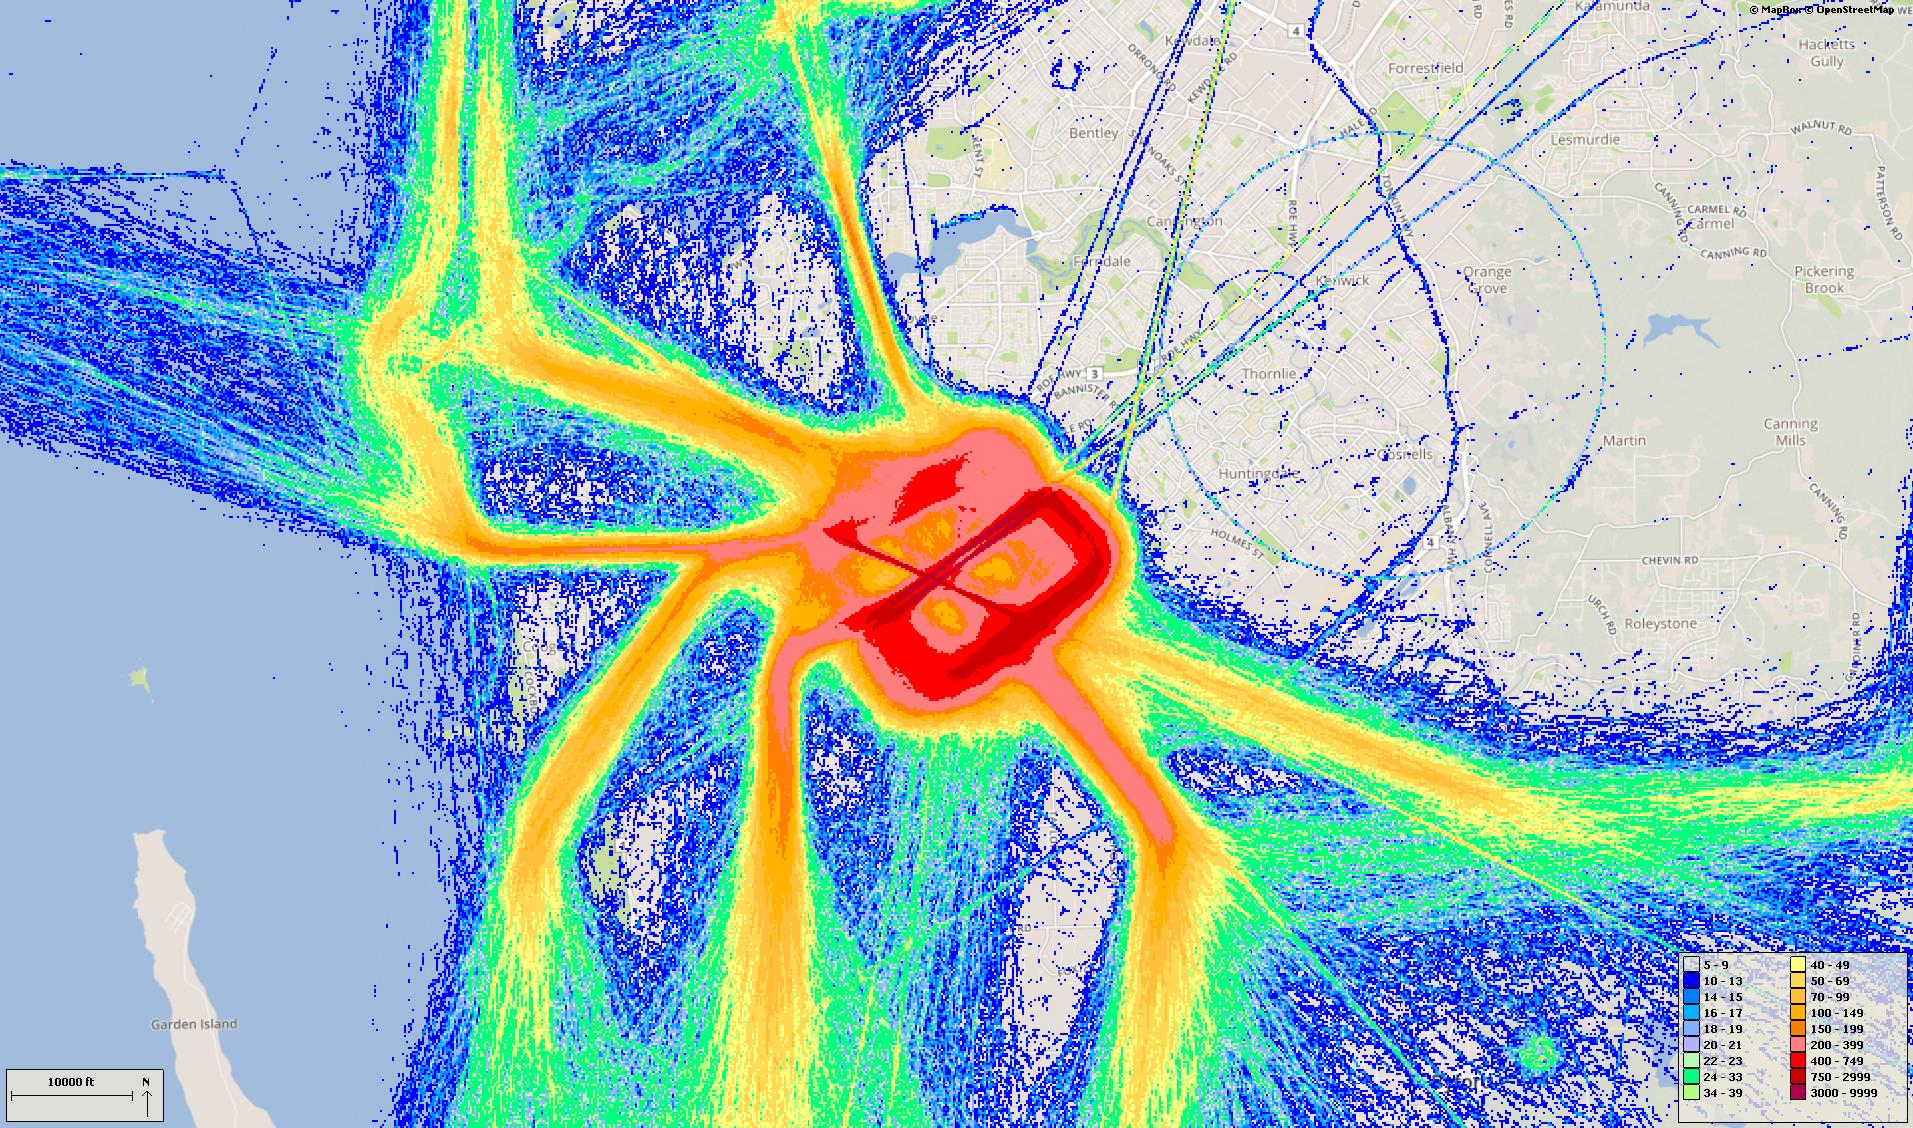
Track density
The following graph shows the density of movements over different suburbs in the quarter. This includes all arrival, departure and circuit movements.
The colours indicate the density of movements over the area. The hotter and deeper the colour, the more movements.
Click the image to enlarge it and return to this page by using the “Back” button in your browser.
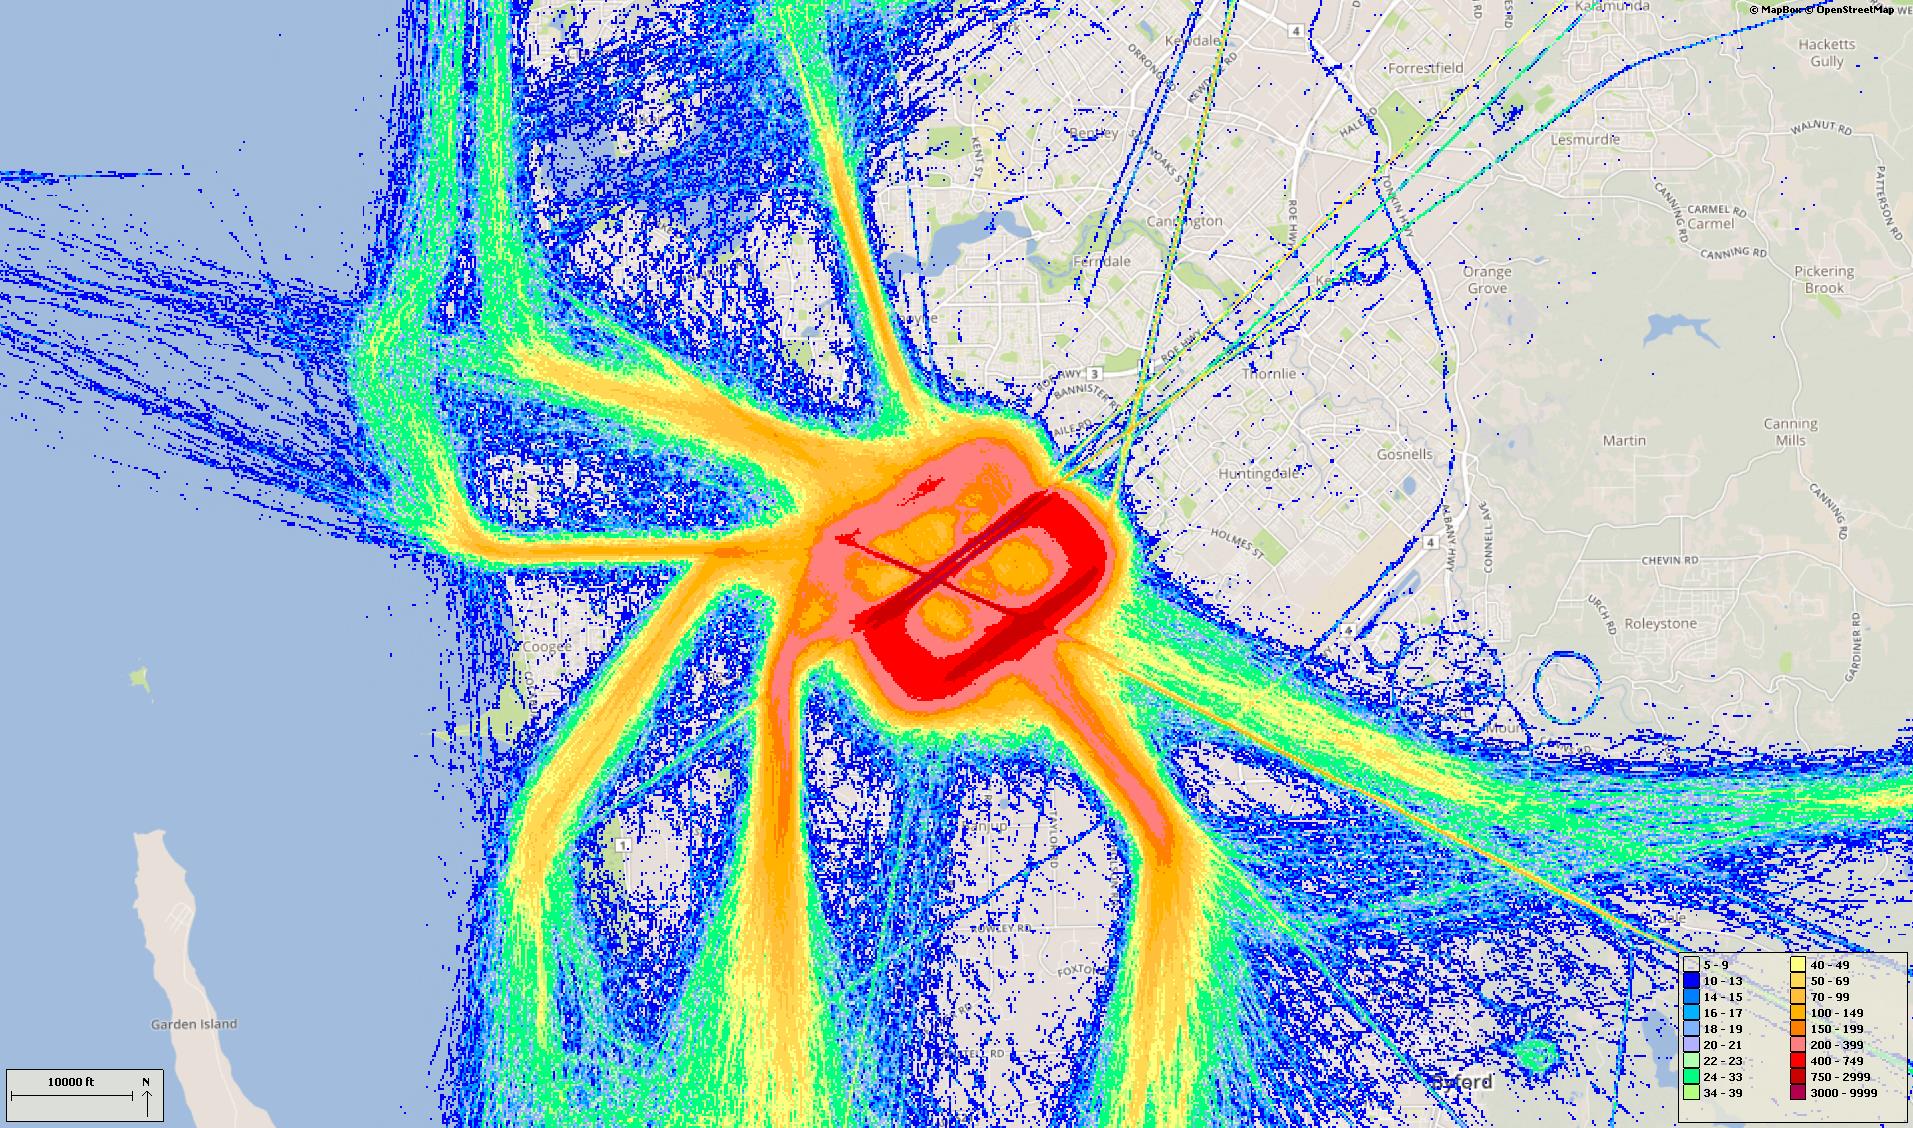
Total movements – percentage by weekday / weekend
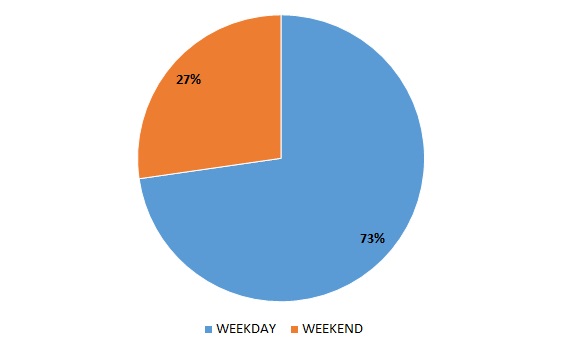
Total movements – percentage by day / night
“Day” is 6am to 11pm and “night” is 11pm to 6am.
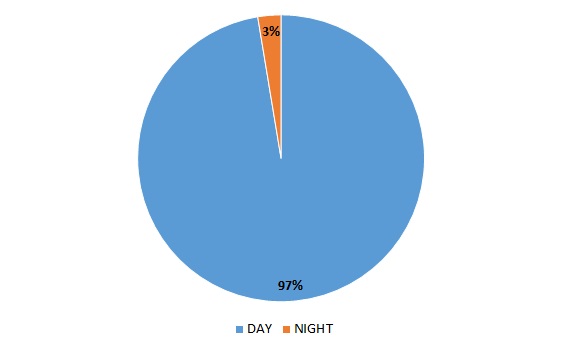
Total movements – percentage per hour by weekday/ weekend
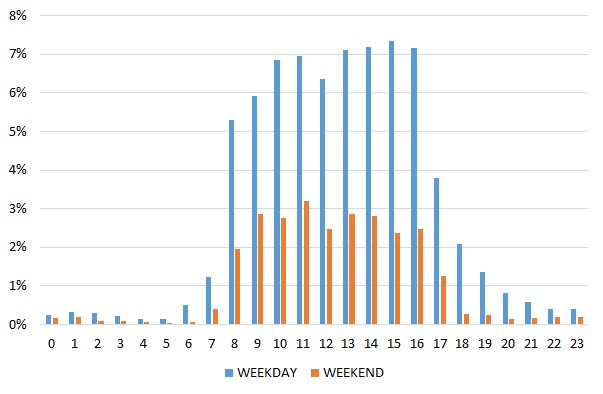
Track density
The following graph shows the density of movements over different suburbs in the quarter. This includes all arrival, departure and circuit movements.
The colours indicate the density of movements over the area. The hotter and deeper the colour, the more movements.
Click the image to enlarge it and return to this page by using the “Back” button in your browser.
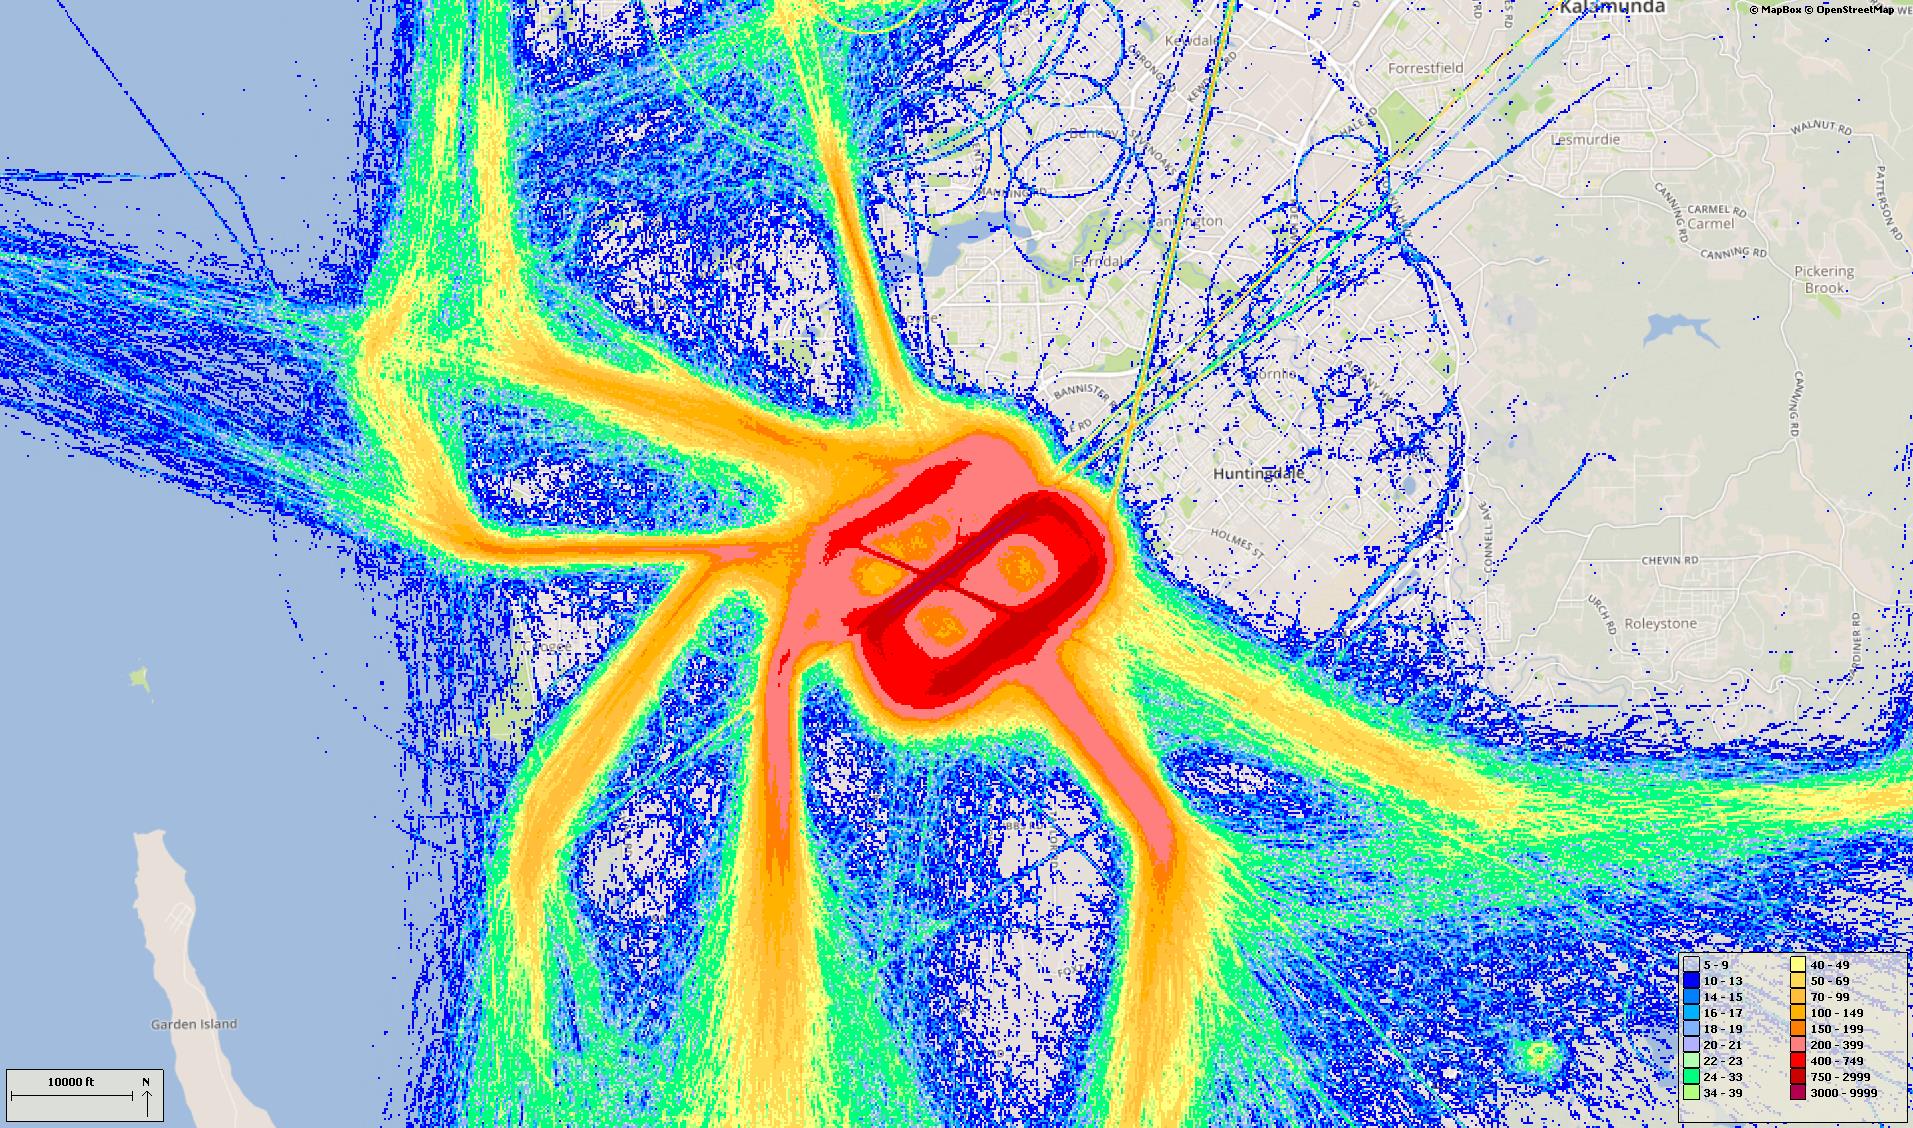
Total movements – percentage by weekday / weekend
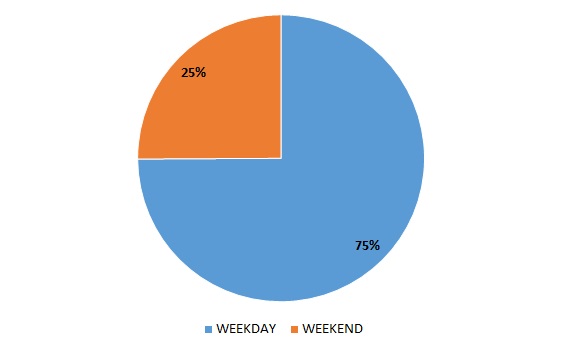
Total movements – percentage by day / night
“Day” is 6am to 11pm and “night” is 11pm to 6am.
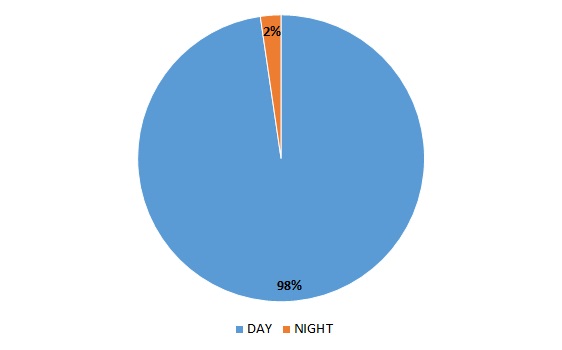
Total movements – percentage per hour by weekday/ weekend
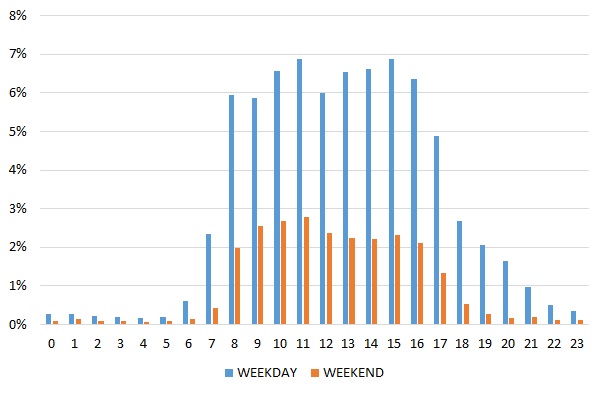
Track density
The following graph shows the density of movements over different suburbs in quarter one. This includes all arrival, departure and circuit movements.
The colours indicate the density of movements over the area. The hotter and deeper the colour, the more movements.
Click the image to enlarge it and return to this page by using the “Back” button in your browser.
