Complaints
Airservices manages enquiries and complaints about aircraft noise and operations through the Noise Complaints and Information Service (NCIS). The information below is collected by the NCIS for the purpose of complaint management, analysis of issues and identification of causal factors. For this reason we refer to ‘complainants’ and ‘issues’. Complainants are people who contacted the NCIS. While some people submitted enquiries or comments rather than complaints, all are referred to as “complainants”. Issues are the primary concern they raised.
Changes to our complaint-reporting format
The new interactive reporting below (effective October 2019) will be monthly, rather than quarterly. New data will be available on the 10th business day of each month.
Use this interactive tool to explore the issues raised by residents from different suburbs. Read an explanation of issues and classifications used in complaint reporting.
Help is provided on both the Complainants and Issues and Classification Screens in the bottom right hand corner of the screen.
If the NCIS have identified something new or unusual in the data, an explanation will be provided in a dated accordion below the interactive reporting. Previous quarterly reporting to January 2016 is under the accordion “Archived”. Yearly reviews of complainant numbers and issues will continue to be provided.
Note: monthly complaints data describes the complaints lodged in that calendar month. Depending on when in the month the matter was lodged, the investigation may not have been completed within the same month. Where an investigation reveals that the issue or classification initially assigned to the matter was not the most appropriate one, this will be corrected. This may result in incremental changes to issue or classification counts for a previous month. Additionally, complainant numbers are now for each month. Previously if a complainant contacted the NCIS each month in a quarter that was reported as one complainant, if you are adding the number of complainants each month, this may not provide a realistic interpretation of the total number of complainants. If you select a month where there were no complainants, nothing will be displayed.
The following tabs contain our previous complaint reports
Complainants
During 2020, there were 258 individual complainants. This is a decrease from 275 in 2019.
The COVID 19 pandemic is the main reason for the decrease, due to international and state border closures, resulting in significantly fewer jet operations. The Movements at Australian Airport reports show that to the end of October 2020 there had been 78 790 aircraft movements, with approximately 75 000 jet operations at Perth Airport. As a comparison at the end of November 2019, there had been 123 056 aircraft movements with approximately 119 000 jet operations. However, this has not had a significant effect on complainant activity, which is opposite to other capital city airports.
In 2020, it appears that Runway closures had a greater impact on the Perth community, and working from home arrangements may have caused this.
In 2020, the NCIS implemented monthly reporting data in lieu of quarterly reporting for all airports. It is important to note that if a resident contacts the NCIS once every month, they are noted as one complainant for each of the 12 months, however, when we record the number of complainants for the calendar year they are only counted as one complainant, regardless of how many times they have contacted us.
Chart 1: Complainants per month, average number of complainants per month for the past three years and total number of complainants 2020
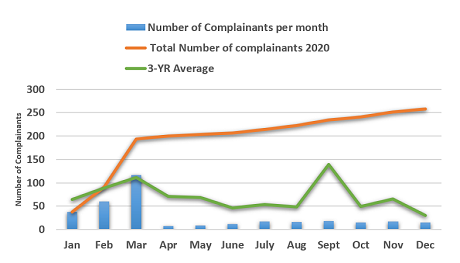
Chart 2: Complainant comparison 2016 to 2020

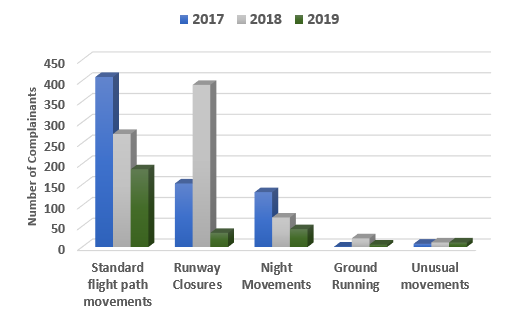
Issues
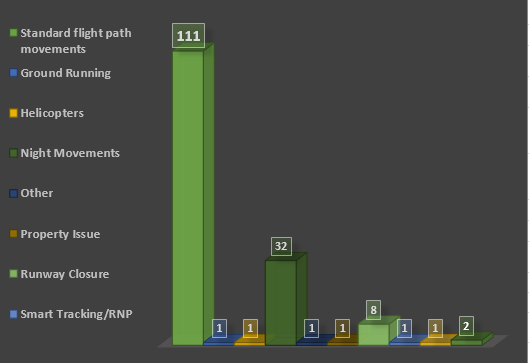
Standard flight path movements remained the main concern in 2020 affecting 74 percent of complainants, compared to 68 percent of complainants in 2019.
Runway closure was the second greatest concern affecting 16 percent of complainants. In 2019, 12 percent of complainants raised this issue. The issue of Runway closure encompasses regular scheduled maintenance as well as larger maintenance issues such as resurfacing the runway. Perth Airport is responsible for the oversight of runway maintenance.
Night movements, affected nine percent of complainants, while 16 percent raised the issue in 2019.
The other issues in Chart 3, include Environmental concerns, Not noise related (a comment on Perth Airport sprinkler system) and Other (political comments).
Chart 3: Issues raised in 2020

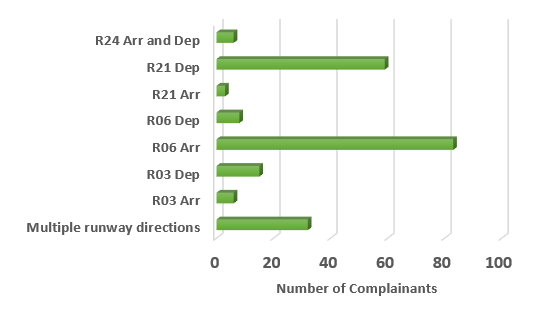
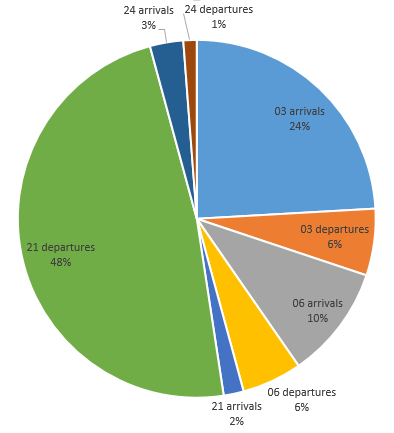
For the three main issues of Standard flight path movements, Night Movements and Runway Closure, the runway direction of most concern to residents is Runway 06 arrivals, which was a concern to 83 complainants. The use of Runway 06 increases if the prevailing winds are easterly. If required maintenance is required on the main north south runway, Runway 03/21, then Runway 06 is used. Perth Airport schedules required maintenance on their website here. Complainant numbers for Runway 06 arrivals in 2020 were 83. In 2019, they were 21.
Runway 21 departures was the second greatest concern, with 59 complainants. This was a decrease from 88 complainants in 2019, and could be a result of fewer jet movements during the COVID-19 pandemic.
Chart 4: Runway directions and complainant numbers affected 2020
Suburbs
In 2020, 88 separate suburbs across the Perth basin recorded complainants, with 45 suburbs recording a single complainant.
Ten suburbs recorded more than five complainants.
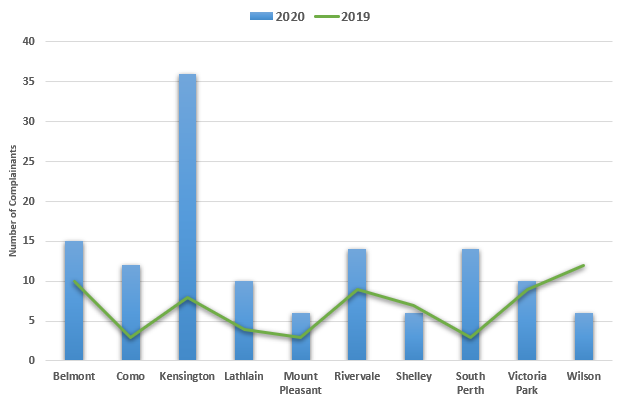
Mount Pleasant, Shelley and Wilson each recorded six complainants. All of these suburbs were disturbed by Runway 21 departures both by day and night. One Wilson resident raised concerns with a runway closure.
The suburb recording the most complainants was Kensington with 36 complainants. Runway 06 arrivals was the main concern to these residents.
The suburbs of Belmont, Rivervale, South Perth, Como, Victoria Park and Lathlain recorded between 10 and 15 complainants. The majority of residents in each of these suburbs were also disturbed by Runway 06 arrivals.
Chart 5: Comparison of Suburbs recording the most complainants in 2020 with 2019
Complainants
There were 275 individual complainants in 2019. This is a considerable decrease from 740 complainants in 2018 and 668 complainants in 2017.
Complainant numbers have been lower in each quarter of 2019 compared to the same period in the previous three years, as can be seen in Chart 1 below, which provides a comparison of complainant numbers for each quarter from 2016 to 2019.
A decrease in concerns on all major issues and most notably runway closures resulted in lower complainant numbers in 2019.
Chart 1: Comparison of complainant numbers by quarter 2016 to 2019
Issues
Standard flight path movements were a concern to 68 percent of complainants in 2019, while night movements affected a further 16 percent. Runway closure was the main issue in 2018, in 2019 only 12 percent of complainants raised this issue.
Chart two below shows the main issues raised in 2019 with a comparison to the number of complainants raising the same issue in 2017 and 2018.
Chart 2: Comparison of main issues and complainant numbers 2019, 2018, and 2017
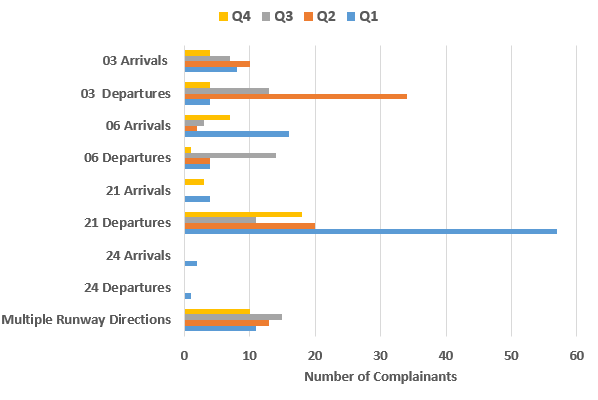
Complainants concerned with standard flight path movements and night movements were affected by all runway modes during the year. Some runways are used to a greater extent during different seasons in the year, due to the prevalent wind in that season. This results in different runway operations being of greater concern at different times of the year. This is shown in Chart 3.
Chart 3: Runway direction comparison and number of complainants affected for each quarter 2019
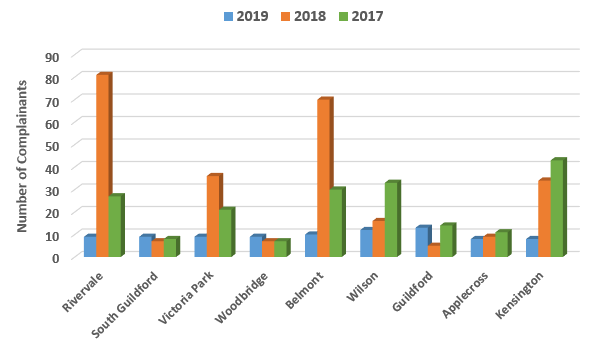
Suburbs
Ninety-seven separate suburbs across the Perth basin recorded complainants in 2019, with 50 suburbs recording a single complainant.
Nine suburbs recorded eight or more complainants, and are in Chart 4, with a comparison of these suburb’s complainant numbers in 2017 and 2018. These suburbs accounted for 33 percent of complainants in 2019.
Guildford recorded the greatest number of complainants in 2019, with 13 complainants. The majority were concerned with standard flight path movements, with 62 percent concerned with Runway 03 departures. Wilson recorded 12 complainants with 92 percent concerned with Runway 21 departure operations.
Belmont recorded 10 complainants. The residents of this suburb were concerned with runway closures, training, standard flight path movements, and Runway 06 arrivals.
Night movements affected residents from 37 suburbs in the Perth basin area with 67 percent of these affected by departures from both Runway 03 and Runway 21.
Chart 4: Suburbs with eight or more complainants, and comparison with 2017 and 2018 complainant numbers
Complainants
There were 67 complainants in quarter three 2019, which is a decrease from 92 in quarter two.
Issues
Standard flight path movements
This was the main issue, affecting 53 complainants.
Runway 06 operations affected 32 percent of these complainants, with Runway 06 departures affecting 26 percent.
Runway 03 operations affected 28 percent of these complainants and Runway 21 operations affected 13 percent.
Movement numbers on Runway 03 were greater in July and August compared to those on Runway 21, while in September Runway 21 use was greater. Runway 06 use was lower than Runway 03 or Runway 21 in all three months of the quarter.
Night Movements
This issue affected 10 complainants, with 50 percent concerned with Runway 03 departures and 40 percent concerned with Runway 21 departure.
The closure of Runway 06/24 for runway works affected three residents in Como.
A further seven complainants were affected by Ground running (2), Training (1), General aviation (1), Environmental concerns (1), and other issues (2).
Chart 1, shows the different runway directions under the issues of Standard flight path movements and Night Movements and the number of complainants affected for quarters 3 and 2.
Chart 1: Runway direction and number of complainants affected quarters 3 and 2

Suburbs
During quarter three 44 separate suburbs recorded complainants. A single complainant was recorded in 27 suburbs.
Swan View, located under the arrival path for Runway 24 and the departure path for Runway 06, recorded four complainants. These complainants were concerned with Standard flight path movements.
Four suburbs recorded three complainants: Belmont, Boya, Helena Valley, and Jane Brook. Runway 06 departures affected residents of Boya, Helena Valley and Jane Brook. Jane Brook residents were also affected by Runway 03 departures. Multiple runway directions, circuit training and runway closures affected Belmont residents.
Chart 2: Suburbs recording three or more complainants and issues raised

Complainants
There were 92 complainants in quarter two 2019, which is a decrease from 140 in quarter one. For the same period last year there were 119 complainants recorded.
The decrease in complainants this quarter is attributable to the closure of Runway 06/24 for the majority of the quarter. When Runway 06/24 is used more often it affects areas of Perth that are more rarely overflown, such as those immediately to the west of the airport. When this does occur complainant numbers usually increase.
Issues
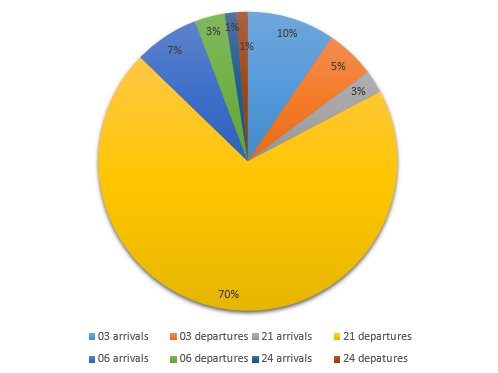
The main issue was Standard flight path movements, which affected 72 percent of complainants.
Forty-four percent of these complainants were concerned with Runway 03 departures.
Movement numbers on Runway 03 were greater in May and June compared to those on Runway 21. Twenty percent of complainants were concerned with Runway 21 departures, while 17 percent were affected by multiple runway directions.
Night movements affected 17 percent of complainants, with 41 percent concerned with Runway 21 departures and 29 percent concerned with Runway 03 departures.
Runway 06/24 was closed due works to all traffic for most of quarter two. This results in concentrated air traffic to the north and south of the airport, and the continual movements over a particular area causes increased concern.
A further nine complainants were affected by Unusual movements (3), Ground running (2), Environmental concerns (1), and other issues (3).
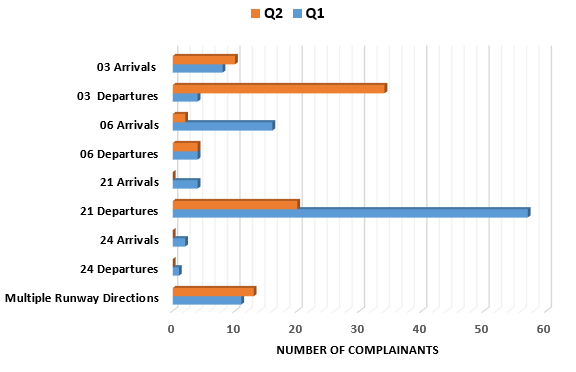
Chart 1, shows the different runway directions under the issues of Standard flight path movements and Night Movements and the number of complainants affected.
Chart 1: Runway direction and number of complainants affected
Suburbs
During quarter two 52 separate suburbs recorded complainants. Thirty-nine suburbs recorded a single complainant.
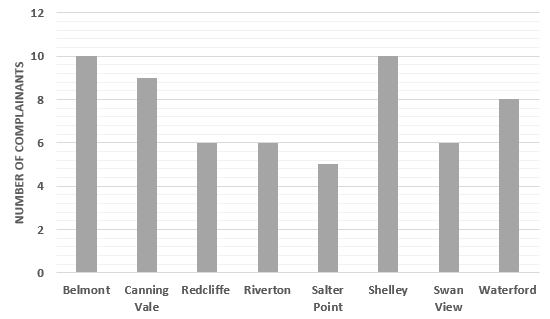
Five suburbs recorded four or more complainants and were located under the arrival path for Runway 03 or the departure path for Runways 03 or 06. These suburbs accounted for 36 percent of all complainants and are shown in Chart 2.
Runway 03 departures was the main concern of residents of these suburbs; it was raised by 76 percent of the complainants. Canning Vale was affected by Runway 03 arrivals.
Chart 2: Suburbs recording five or more complainants
Complainants
There were 140 complainants in quarter one 2019. This is a decrease from 193 complainants in quarter four 2018. It is also a decrease from the same period last year, where there were 149 complainants.
Issues
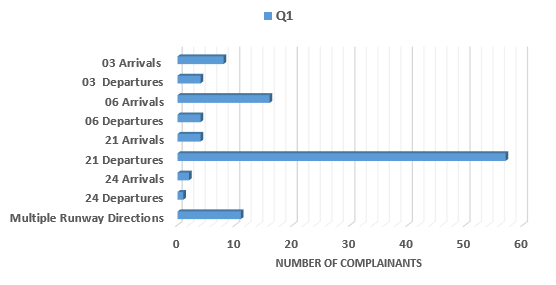
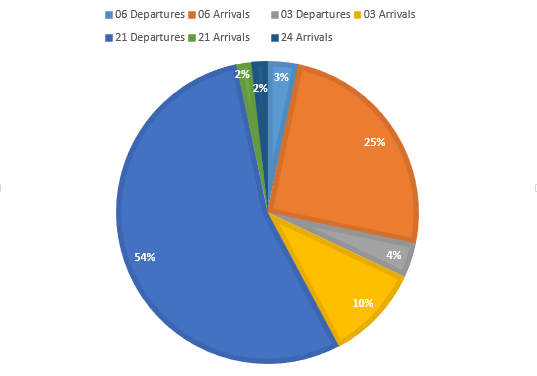
The main issue was Standard flight path movements, which affected 64 percent of complainants. Forty nine percent of these complainants were concerned with Runway 21 departures. Movement numbers on Runway 21 continued to be considerably higher this quarter compared to those on Runway 03.
Other issues include Runway closure, affecting 19 percent of complainants, and Night movements, 14 percent. Runway 03/21 was closed between 11 March and 30 March between 8am and 5pm Monday to Saturday for runway works. A further 11 complainants were affected by Unusual movements, Property information and Ground running.
Chart 1, shows the different runway directions under the issues of Standard flight path movements and Night Movements and the number of complainants affected.
Chart 1: Runway direction and number of complainants affected
Suburbs
During quarter one 65 separate suburbs recorded complainants. Thirty-eight suburbs recorded a single complainant.
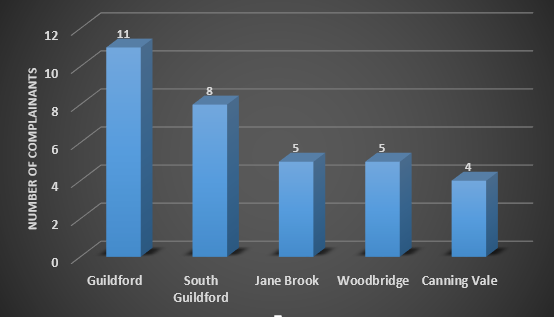
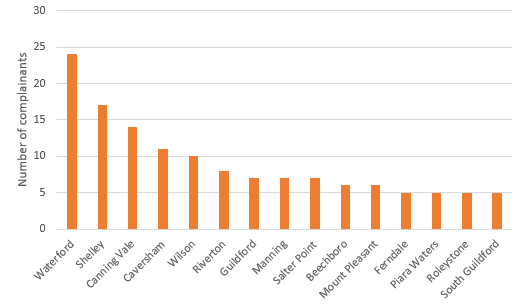
Seven suburbs recorded five or more complainants and these are shown in Chart 2. These suburbs accounted for 32 percent of all complainants.
Runway 21 departures was the main concern of residents of these suburbs; it was raised by 47 percent of the complainants. Runway closure was raised by 28 percent of complainants while Runway 06 arrivals was raised by 21 percent of these complainants.
Chart 2: Suburbs recording five or more complainants
Complainants
In 2018 there were 740 individual complainants. This is an increase from 668 complainants in 2017, but a decrease from 1431 complainants in 2016.
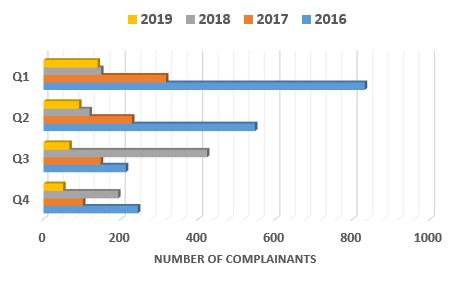
Forty nine percent of complainants in 2018 were affected by the issue of Runway Closure, and this was the main reason for an increase in complainants. While Perth Airport regularly closes both runways for required maintenance, the drilling works and associated runway closures which occurred mainly in quarter three were the main concern to complainants. This can be seen in Chart 1, which provides a comparison of complainant numbers for each quarter from 2016 to 2018.
Chart 1: Comparison of complainant numbers by quarter 2016 to 2018
Issues
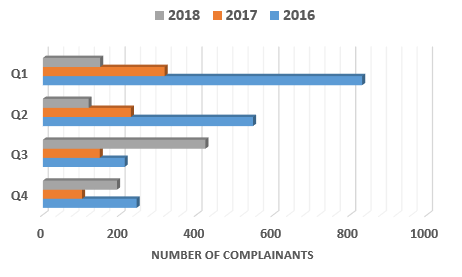
Chart 2 below shows the main issues raised in 2018 with a comparison to the number of complainants raising the same issue in 2016 and 2017.
Chart 2: Comparison of main issues and complainant numbers 2018, with 2016 and 2017
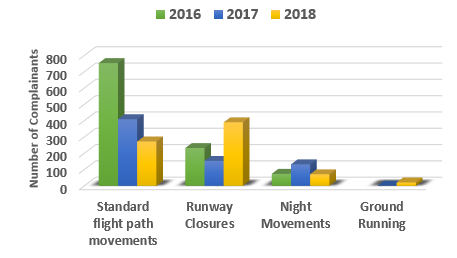
Standard flight path movements from Runway 21 continue to cause the most concern to residents. This is recorded each quarter and can be seen in the 2018 October to December tab, Chart 1. Additionally, Runway 21 departures affected 55 percent of complainants under the issue of night movements.
Suburbs
In 2018 across the Perth basin, 111 separate suburbs recorded complainants; with 41 suburbs recording a single complainant.
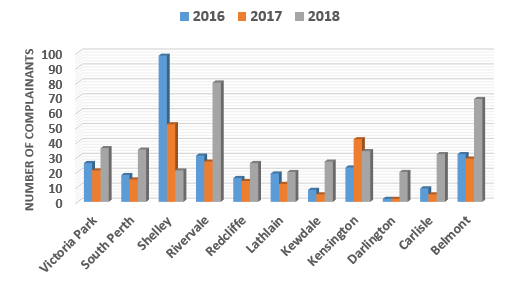
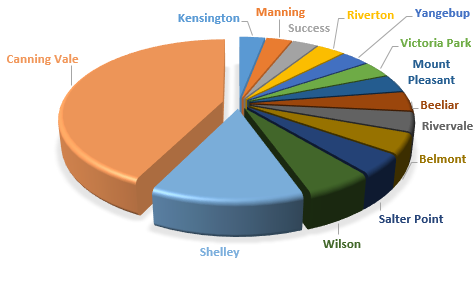
Eleven suburbs recorded 20 or more complainants. These are shown in Chart 3 below, with a comparison of the complainant numbers for these suburbs in 2016 and 2017. These suburbs accounted for 54 percent of complainants in 2018.
All of these suburbs except for Shelley were affected by the runway closures of 2018.
Standard flightpath movements and/or night movements also affected all of these suburbs. The suburbs of Belmont, Carlisle, Kensington, Kewdale, Lathlain, Redcliffe, South Perth and Victoria Park are usually affected by Runway 06 arrivals. Runway 06 is the least used runway at Perth, as its use only occurs when there are strong easterly winds. While these did occur in 2018, the increase in complainant numbers for these issues is due to the closure of the north south runway due to the drilling project.
Shelley is affected by Runway 21 departures, and residents were affected by both day and night operations.
Ground running affected residents in Darlington, Redcliffe and Riverdale.
Chart 3: Suburbs with 20 or more complainants, and comparison with 2016 and 2017 complainant numbers
Complainants
There were 193 complainants in the fourth quarter of 2018. This is a significant decrease from 423 complainants in the third quarter.
There were 740 complainants for the 2018 calendar year.
Issues
The main issue reported in quarter four was Runway closure. Both Runway 03/21 (north south) and Runway 06/24 (east west) were closed for significant period during the quarter to accommodate the tunnel boring.
Standard flight path movements were a concern to 38 percent of complainants this quarter, and Night movements affected nine percent.
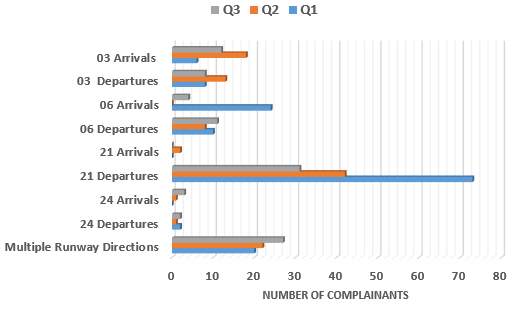
Chart 1 below, shows the different runway directions under the issues of Standard flight path movements and Night Movements and the number of complainants affected. A comparison is provided with quarter one, quarter two and quarter three 2018.
Chart 1: Runway direction comparison Q1, Q2, Q3 and Q4 2018 and number of complainants affected
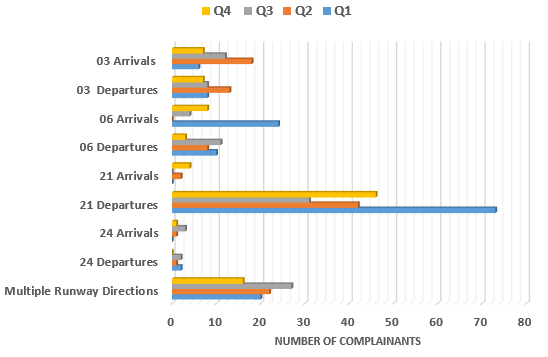
Other issues raised by complainants in quarter four, were Unusual movements, Property requests, and general aviation traffic. These and not noise related issues were raised by eleven complainants in total.
Suburbs
During quarter four 66 separate suburbs recorded complainants. Thirty one suburbs recorded a single complainant.
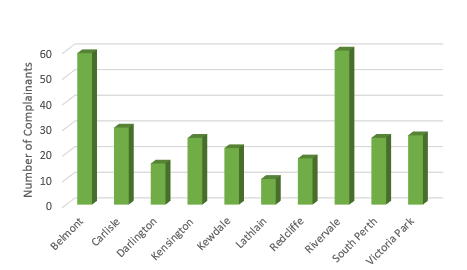
Twelve suburbs recorded five or more complainants and these are shown in Chart 2 below. These 12 suburbs accounted for 52 percent of all complainants.
Chart 2: Suburbs recording five or more complainants
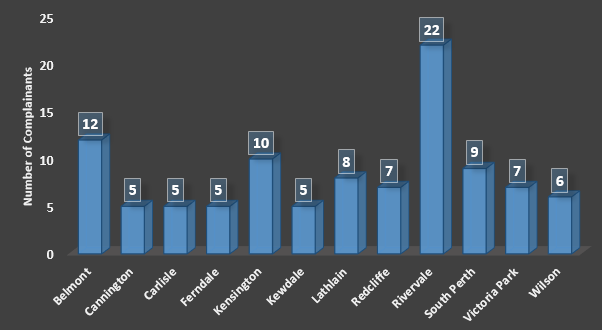
The majority of Rivervale, Belmont, Kensington, South Perth, Lathlain, Victoria Park, Carlisle and Redcliffe residents were affected by the Runway Closures.
Runway 21 departures were the main concern to the other suburbs.
Complainants
There were 423 complainants in the third quarter of 2018. This is a significant increase from 119 complainants in the second quarter and from 148 complainants for the same quarter in 2017.
There have been 612 complainants for the year to date.
The main reason for the increase of complainants in the third quarter was runway closures; 73 percent of complainants were affected. Due to significant infrastructure construction both the north-south runway, Runway 03/21, and the east-west runway, Runway 06/24, have been closed at different times for considerable periods during this quarter. This has resulted in increased traffic using the open runway at the airport.
Issues
Standard flight path movements were a concern to 18 percent of complainants this quarter, while five percent were concerned with Night movements.
Chart 1 below, shows the different runway directions under the issues of Standard flight path movements and Night Movements and the number of complainants affected. A comparison is provided with quarter one and quarter two 2018.
Historically the use of Runway 21 starts to increase in quarter three while the use of Runway 03 decreases. This is due to the effect of seasonal winds. However due to the construction at the airport affecting the runway in use, from August 2018, there has been an increase in use of Runway 06/24 this quarter.
Chart 1: Runway direction comparison Q1, Q2, and Q3 2018 and number of complainants affected
Other issues raised by complainants in quarter three were the new runway project, ground running at the airport, and unusual movements.
The NCIS refers all ground running complaints and enquiries on the new runway project to Perth Airport.
The unusual movements were due to weather diversions and an aircraft conducting a missed approach.
Suburbs
Complainants were recorded from 64 separate suburbs with 22 suburbs recording 4 or more complainants. Ten suburbs recorded 10 or more complainants and these are shown in Chart 2 below. These ten suburbs represent 69 percent of all complainants in quarter three.
The suburbs with the most complainants were Rivervale with 60 complainants, Belmont 59 complainants, Carlisle 30 complainants, and Victoria Park with 27 complainants. Kensington and South Perth both had 26 complainants while Kewdale recorded 22 complainants. All of these suburbs are affected by Runway 06/24 operations and the closure of the main runway impacts these residents. A single complainant was recorded from 25 suburbs.
Chart 2: Suburbs recording ten or more complainants
Complainants
There were 119 complainants in the second quarter of 2018. This is a decrease from 149 complainants in the first quarter and a significant decrease from 229 complainants for the same quarter in 2017.
There have been 233 unique complainants for the year to date.
Issues
The main issues concerning complainants continue to be Standard flight path movements and Night Movements. These issues affected 90 percent of complainants.
The following chart shows the different runway directions under the issues of Standard flight path movements and Night Movements and the number of complainants affected. A comparison is also provided with quarter one 2018.
Historically the use of Runway 21 declines in quarter two and the use of Runway 03 increases. This is due to the effect of Seasonal Winds. Perth Airport conducts regular runway maintenance each Friday, alternating between Runway 03/21 and Runway 06/24. When this occurs operations are confined to a single runway for a period of four hours. More information can be found on Runway Works on the Perth Airport website.
Chart 1: Runway direction comparison Q1 2018 and Q2 2018 and number of complainants affected
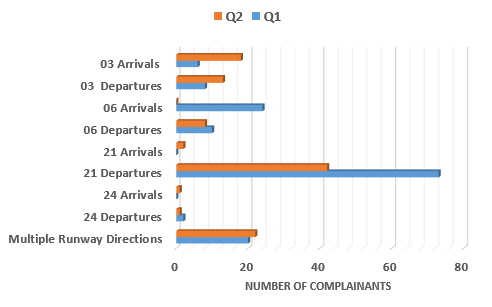
Other issues raised by complainants in quarter two were environmental concerns (odours) and ground running at the airport. The NCIS refers all ground running complaints to Perth Airport.
Traffic management resulted in some aircraft on unusual flight paths in quarter two, and this affected the suburbs of Bassendean, Darlington, East Fremantle, Gosnells and Subiaco.
Suburbs
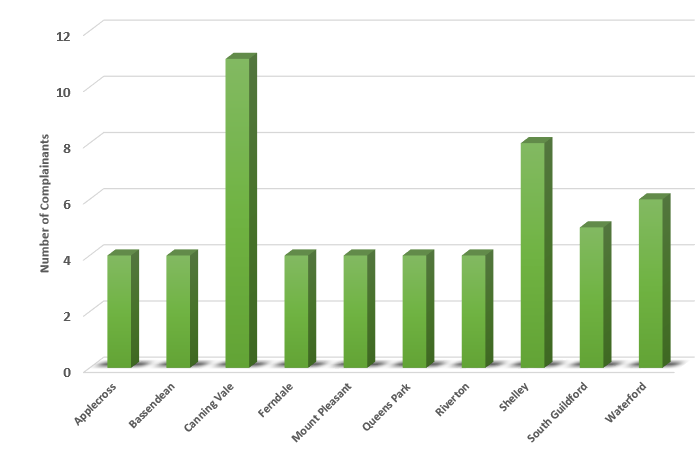
Fifty six separate suburbs across the greater Perth basin recorded complainants in quarter two. Ten suburbs recorded four or more complainants, and these are shown in Chart 2 below. These ten suburbs represent 45 percent of all complainants.
The residents of Applecross, Ferndale, Mount Pleasant, Riverton, Shelley and Waterford continue to be affected by Runway 21 departures both day and night.
Arrivals and departures from Runway 03 were a concern to residents of Canning Vale and South Guildford.
Ground Running affected the suburbs of Bassendean, Redcliffe and South Guildford.
Thirty suburbs recorded a single complainant.
Chart 2: Suburbs recording four or more complainants
Complainants
There were 149 complainants in the first quarter of 2018. This is a significant increase from 102 complainants in quarter four 2017, but is consistent with quarter three 2017.
It is a significant decrease from 371 complainants for the same period last year.
The significant increase in complainants for the issues of Night Movements and Standard flight path issues was the cause of the increase in complainants this quarter. This can be seen in Chart 1, and is discussed further under Issues.
Chart 1: Comparison of complainant numbers Q1 2018 and Q4 2017 across the main issues
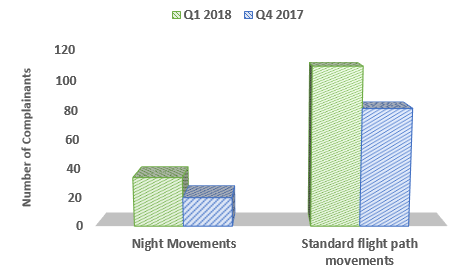
Issues
During quarter one the two main issues were; Standard flight path movements which affected 76% of complainants and Night movements, which affected 23% of complainants. Night movements continue to cause the most concern when departing Runway 21.
Other issues of concern during the quarter included Unusual movements which affected two complainants, Ground Running at the airport, affecting two complainants and Property purchase enquiries.
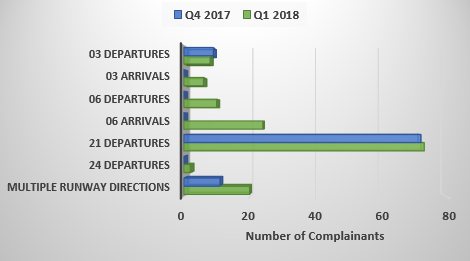
The following chart shows the different runway directions under the issues of Standard flight path movements and Night Movements and the number of complainants affected. A comparison is also provided with quarter four 2017.
This shows that complainants affected by operations to the main north/south runway, Runway 03/21, remained consistent across the two quarters. However, operations on the east/west runway, Runway 06/24, shows a marked increase. These operations affected 34 complainants or 23% of complainants. Historically due to seasonal wind and weather effects the use of Runway 06 can increase in quarter one and can continue into quarter two. Our Fact Sheet, Runway Selection, discusses the considerations taken into account when choosing the active runway.
Chart 2: Runway direction comparison Q1 2018 and Q4 2017 and number of complainants affected
Suburbs
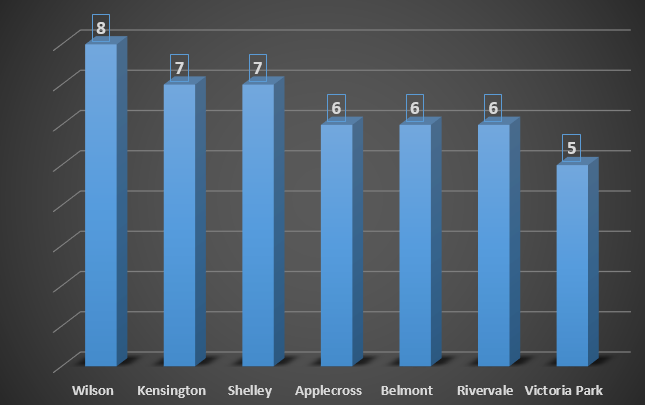
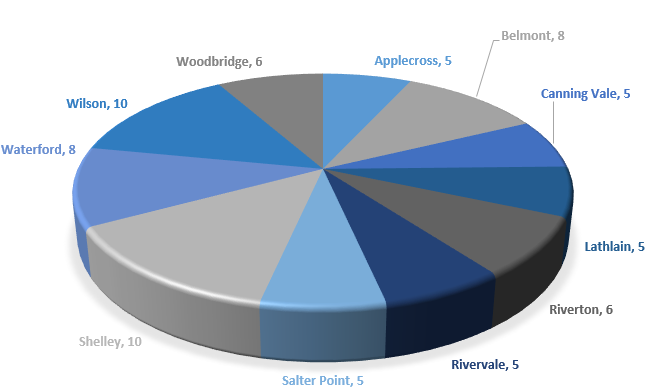
Residents from 55 separate suburbs contacted NCIS in quarter one. Eleven suburbs recorded five or more complainants and these are shown in Chart 3. These suburbs represent 49% of all complainants.
The residents of Applecross, Riverton, Salter Point, Shelley, Waterford and Wilson were affected by Runway 21 departures both day and night.
Runway 06 operations affected the residents of Belmont, Lathlain, Rivervale and Woodbridge.
Twenty three suburbs recorded a single complainant.
Chart 3: Suburbs recording five or more complainants
Complainants
In 2017 there were 668 individual complainants. This is a significant decrease from 1431 complainants in 2016.
In 2016 one of the key issues was the proposed night-time respite flight path study which affected many residents to the south of the airport. In 2016 this issue alone affected 521 complainants. See the Investigations page for more information about this study.
Issues
The main issues for 2017 were standard flight path movements, runway closures and night movements. These issues accounted for 97 per cent of complainants. It is important to remember that a single complainant may have one or more issues.
The issue of unusual movements was mainly raised for aircraft which were required to be taken off the standard flight path for traffic management reasons. This is a procedure used by air traffic control to ensure the safety of aircraft, as they come into potential conflict with each other in the smaller volume of airspace surrounding the airport. Two complainants under this issue were concerned about weather diversions and an aircraft executing a missed approach.
The issue of “other” as shown in Chart 1 below, affected 14 complainants, and encompasses requests for property information, ground running, training, helicopter activities and requests for information that were not noise related.
Chart 1: Main issues 2017 and percentage of complainants affected
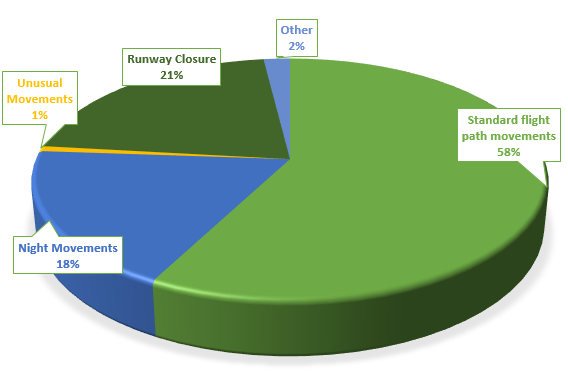
Chart 2 below shows the complainants under the main issues of standard flight path movements, night movements and runway closures; and the runway directions which affected them. Additionally the number of complainants who were affected under night movements for each runway direction is also illustrated.
Required runway maintenance was conducted for both runways primarily in the first six months of the year. The majority of the work on Runway 03/21 was conducted during the hours of 08:00 to 15:00 over a seven week period. However Runway 06/24 was closed entirely for nearly three months from the end of March. The effect of these works is to concentrate aircraft over the suburbs under the flight paths of the other runway.
Chart 2: Complainants affected by the main issues of 2017 and the runway direction used
Suburbs
In 2017 across the Perth basin, 118 separate suburbs recorded complainants; with 47 suburbs recording a single complainant.
Thirteen suburbs recorded 15 or more complainants. These are shown in Chart 3 below, with a comparison of the complainant numbers for these suburbs in 2016.
All of these suburbs except for Guildford are to the south and west of the airport. Guildford is to the north of the airport and the main issues that concerned these residents in 2017 were Runway 21 arrivals, Runway 03 departures and the closure of Runway 06/24.
The suburb of Canning Vale is aligned with the approach path for Runway 03. Canning Vale residents are disturbed when the prevailing wind is a northerly.
The suburbs of Belmont, Como, Kensington, Redcliffe, Rivervale, South Perth and Victoria Park were all affected by arriving traffic on Runway 06. This occurs when Runway 03/21 is closed for maintenance or the prevailing wind is an easterly. These suburbs accounted for 178 or 26 per cent of complainants.
The suburbs of Salter Point, Shelley, Waterford and Wilson are under the main departure path from Runway 21 for aircraft tracking to the west and north. This path is used when the prevailing wind is southerly. These suburbs accounted for 146 or 22 per cent of complainants. See the Investigations page for details of the investigations that have been conducted into potential noise improvements in these and other suburbs of Perth.
Chart 3: Suburbs with 15 or more complainants, and comparison with 2016 complainant numbers
Complainants
There were 102 complainants in the fourth quarter of 2017. This is a decrease from 148 complainants in quarter three. In quarter four 2016 there were 244 complainants.
There were 668 individual complainants in 2017.
Issues
In quarter four the two main issues were; Standard flight path movements which affected 79 per cent of complainants and Night movements, which affected 19 per cent of complainants.
Unusual movements affected three complainants. The reasons for these movements included weather diversions, traffic management and an aircraft executing a missed approach.
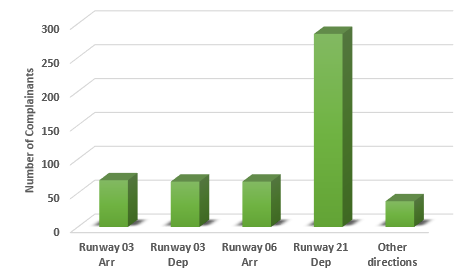
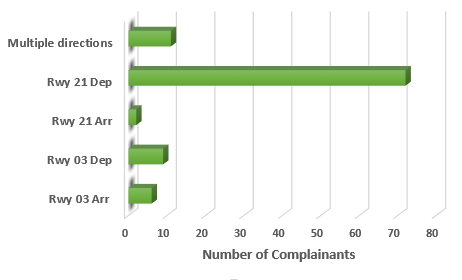
Chart 1 shows the different runway directions under the issue of Standard flight path movements used and the number of complainants affected. Historically due to seasonal wind and weather effects the use of Runway 21 does increase in this quarter.
Chart 1: Runway directions and number of complainants affected
Suburbs
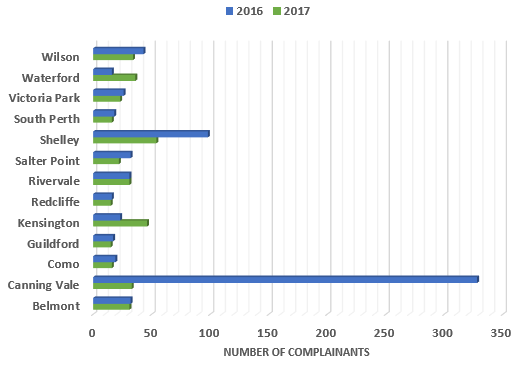
During quarter four, residents from 45 separate suburbs across the Perth basin, recorded complainants. Twenty five suburbs recorded a single complainant.
Chart 2 shows the suburbs recording five or more complainants. All of these suburbs were affected by Runway 21 departures, and 25 per cent of complainants from these suburbs were concerned about night movements. Additionally these suburbs represent 47 per cent of all complainants in quarter four.
Chart 2: Suburbs recording five or more complainants
Complainants
There were 148 complainants in the third quarter of 2017. This is a significant decrease from 229 complainants in quarter two. In quarter three 2016 there were 213 complainants.
There have been 622 individual complainants for the year to date.
Issues
Seventy percent of the issues raised by complainants in quarter three were regarding standard flight path movements. Twenty percent of complainants were affected by night movements.
Required runway maintenance during August and emergency repairs in July affected five percent of complainants with the issue of runway closure.
During the quarter there were several missed approaches due to inclement weather and unusual aircraft operations. One complainant under the issue of unusual movements was affected by these operations, while the other was affected by operations by an Antonov in September.
Chart 1: Issues and number of complainants who raised them in quarter three
The NCIS continues to refine how issues are classified and applied. We have recently decided to classify all complaints regarding movements that are tracking on the relevant flight path and within the normal altitudes as Standard flight path movements. In our reporting to the community this will provide greater clarity about what can be expected in the normal course of operations at the airport. Unusual movements will only be used for commercial aircraft operating outside their usual flight paths at major airports. Examples of unusual movements will include, weather diversions, traffic management, radar departures, direct tracking and missed approaches.
The Night Movements category has been expanded beyond the previous 11pm – 6am hours to cover complainants who advise the NCIS that they have been disturbed by air traffic at any hour of the night.
Suburbs
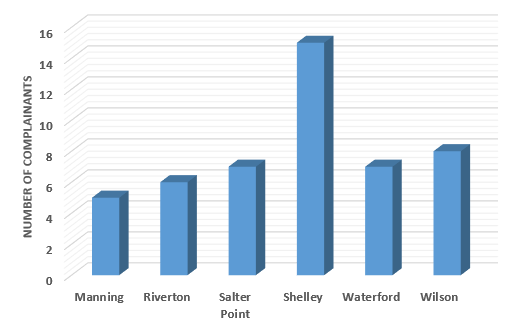
Sixty-seven separate suburbs recorded complainants in quarter three. Thirty-three suburbs recorded a single complainant. The suburbs recording five or more complainants are shown in Chart 3 below.
Belmont was primarily affected by the Runway closures and Runway 06 arrivals. Waterford and Shelley by Runway 21 departures and Canning Vale by Runway 03 arrivals.
Chart 2: Suburbs recording five or more complainants
Complainants
There were 229 complainants in the second quarter of 2017. This is a significant decrease from 371 complainants in quarter one.
There have been 541 individual complainants for the year to date. For the same period in 2016 there were 1198 individual complainants.
Issues
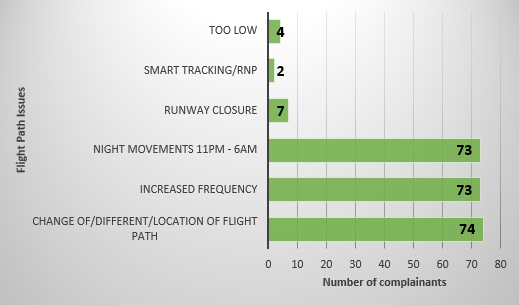
The main concerns were flight path issues which included increased frequency, a perception that something had changed, the location of the flight path, night movements and runway closures. Other issues raised included general aviation traffic, helicopter activities and military movements.
Chart 1: Flight path issues and number of complainants who raised them, quarter two
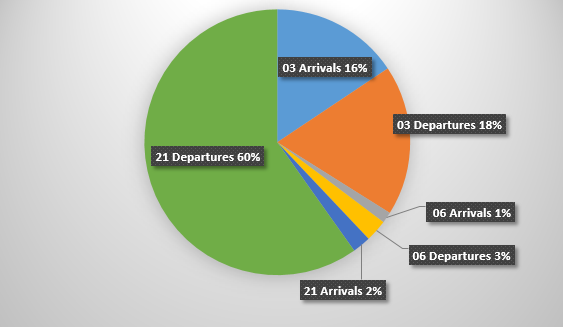
The majority of complainants concerned with flight path issues were affected by Runway 21 departures. As the quarter progressed Runway 03 received more use due to the change in the seasonal wind pattern bringing more northerly winds.
Chart 2: Percentage of complainants with flight path issues affected by each runway direction
Suburbs
Seventy-four separate suburbs across the greater Perth basin recorded complainants in quarter two. Nearly half of these (38) had one complainant each. Thirteen suburbs had two complainants, four had three complainants and a further four suburbs had four complainants each.
Chart 3: Suburbs with five or more complainants
There were 371 complainants in the first quarter of 2017. This is a significant increase from 244 complainants in the fourth quarter of 2016 but well below the first quarter of 2016 (830).
Issues
The main issues for quarter one were the closure of the main runway, raised by 143 complainants, and flight path issues including a perception that something had changed, increased frequency of movements and night movements with a total of 244 complainants. Some complainants raised two or more issues and are therefore double-counted in the figures in this section.
Runway closures
The number of complainants attributed to the issue of runway closure was greater than the increase in the total number of complainants for this quarter.
Due to lighting upgrade for the instrument landing system the longer north south runway 03/21 was not available for use for large portions of the day in February and March. At other times the cross runway 06/24 was also closed, this closure is programmed to continue until June 2017.
When a runway is unavailable for use, this increases the amount of air traffic on the runway that is available. Additionally if the runway that is being used is one that is used less often, such as runway 06/24, residents are more greatly affected.
During quarter one there were also several days when strong easterly winds occurred. This necessitates the use of the smaller cross runway 06/24 due to excessive crosswind on the main runway. When this occurred many residents who were aware of the times of the runway closures contacted the NCIS again wondering why movements continued outside the closure hours. In such wind conditions, use of the cross runway is unavoidable.
Flight path issues
The following chart shows that even though the longer runway was closed for a considerable part of the quarter, the runway direction that caused the most concern to residents this quarter was Runway 21 departures. This was followed by Runway 06 arrivals.
For information about the comprehensive investigations Airservices has conducted into flight path issues, see the Investigations page.
Chart 1: Flight path issues – runway directions complained of
Suburbs
69 separate suburbs across the greater Perth basin recorded complainants in quarter one. The suburbs that recorded the most complainants were Kensington (42), Shelley (35), Rivervale (26), Belmont (24), Wilson (22), Victoria Park (21), Canning Vale (18), South Perth (15), Lathlain (13), Salter Point (11), Como (11), Manning (10), Mount Pleasant (9), Redcliffe (9), Riverton (8), Roleystone (6), Swan View (6) and Waterford (5).
The suburbs with the most complainants concerned by use of the crossing runway due to the main runway closure were Kensington (raised by 31 complainants), Rivervale (17), Belmont (16), Lathlain (14), Victoria Park (13), Como (8), South Perth (8) and Redcliffe (7). All of these suburbs are to the east of the airport and are underneath the arrival path for Runway 06.
The suburbs with the most complainants concerned about Runway 21 departures were Shelley (34), Wilson (21), Salter Point (11), Manning (10), Mount Pleasant (9), Salter Point (7), Applecross (6), Riverton (6), Ferndale (5) and Roleystone (5).
In 2016 the total number of individual complainants was 1431. Some of these complainants raised more than one of the issues discussed below.
Issues
595 complainants raised issues that were to do with flight paths including increased frequency of use, perceptions there had been a change, night-time movements and altitudes. Canning Vale complainants raised these issues the most frequently (131 complainants) followed by Shelley (81), Wilson (37) and Salter Point (29).
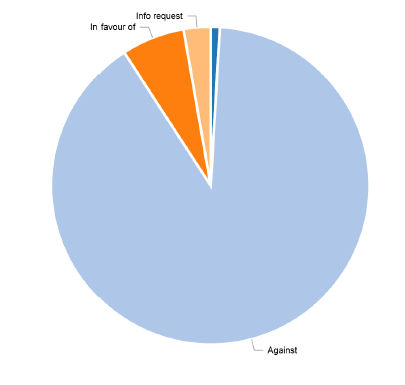
A key issue for 2016 was the data validation study associated with the proposed night-time respite southern departure flight path which attracted submissions from 521 complainants. This proposal is one of more than thirty explored with the aim of identifying noise improvements in Perth. This proposal will not be progressed further due to modelling and validation flights showing that this would not be a noise improvement. More information is available on the Investigations page. Suburbs with ten or more complainants raising this issue were Canning Vale (231), Beeliar (25), Success (18), Yangebup (17), Jandakot (15) and Atwell (12). All were against the proposal. Shelley (17) was the only suburb with ten or more complainants in favour of the proposal.
Periodic runway closures during the year resulted 232 complainants raising this issue. Closures of the main runway required more use of crossing runway. Residents to the south-west of the crossing runway typically experience only intermittent use of this runway end as it is the least preferred under the preferred runway scheme. The runway will always be used when the wind requires it but this occurs quite infrequently. In contrast closure of the main runway requires use of the crossing runway for sustained periods and this is very noticeable to these areas. Suburbs with ten or more complainants raising this issue were Belmont (24), Rivervale (20), Kensington, Lathlain and Victoria Park (all 15), South Perth (12), Como (11) and Redcliffe (10).
Complainants
Some complainants raised more than one issue in 2016 and are therefore double-counted in the discussion above. When individual complainants are looked at by suburb only (irrespective of the issue or issues they raised), a total of 151 suburbs had one or more complainants. 89 suburbs had between one and four complainants. 28 suburbs had between five and nine complainants each. 20 suburbs had 10 to 19 complainants. There were 14 suburbs with more than 20 complainants as shown in the chart below. This chart depicts a total of 768 complainants or 54 per cent of all Perth Airport complainants. Of these, Canning Vale had 328 complainants, Shelley 98, and at the other end of the scale Kensington, Manning and Success had 23 each.
The most-raised issues were increased frequency of movements and concerns that something had changed which could be traced to a change in frequency. Due to Perth’s seasonal wind patterns, runway use changes throughout the year which often gives rise to a perception that something has changed. In quarter four, use of Runway 21 tends to increase as southerly winds become more prevalent. Of the six suburbs with the most complainants in quarter four, five of these suburbs are affected by Runway 21 departures: Shelley (55), Wilson (20), Salter Point (16), Mount Pleasant (13) and Manning (10). The remaining suburb, Canning Vale (14), is affected by Runway 03 arrivals which tend to predominate in the cooler months. Canning Vale is also affected by Jandakot Airport traffic.
Issues
Runway closures continued throughout the first two months of the quarter (see quarter two), ending in early September. As a result Runway 06 arrivals peaked to its highest use compared to previous years during the month of August.
During this quarter Runway 21 use increased compared to the previous quarter, and Runway 03 use dropped. This is due to Perth’s seasonal wind patterns. As the following chart shows, contacts from complainants reflects this runway use.
Chart: Percentage of complainants concerned with runway use
Complainants and suburbs
There were 212 complainants during the third quarter. For the year to date there have been 1307 “unique” complainants, that is, NCIS has been contacted once or more by 1307 individuals.
47 complainants were concerned about runway closures. The most complainants came from Belmont (eight) and Rivervale (four), both of which are affected by arrivals from and departures to the south-west.
23 complainants were from Canning Vale and were concerned about Runway 03 arrivals. Complainants concerned about Runway 21 departures came from suburbs including Shelley (16), Wilson (12), Riverton (10), Manning (7) and Salter Point (6). Guildford, which is affected by both Runway 03 departures and Runway 21 arrivals, had six complainants. Sixty-four suburbs had between one and five complainants each.
Issues
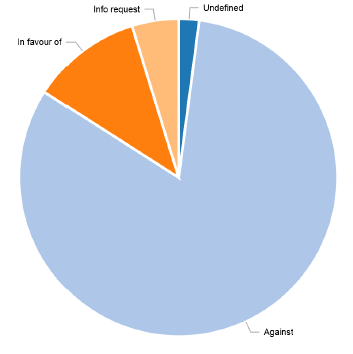
The data validation study (see quarter one) ended in April. 109 complainants contacted NCIS about the study:
Chart 1: Data validation study
203 complainants were concerned about runway closures. Throughout the second quarter, Perth Airport was conducting runway maintenance and upgrades. This required each runway to be closed at different times. This meant that all traffic had to use the other runway during the closure periods.
This resulted in an increased use of the crossing runway at times when the main runway was closed, and vice versa. Runway 06 and Runway 24 use in particular peaked compared to previous years with data showing higher use than would have otherwise occurred. Use of the south-western end of the crossing runway is historically low because these are the least-preferred options under the Noise Abatement Procedures due to the close proximity of residences to the end of this runway.
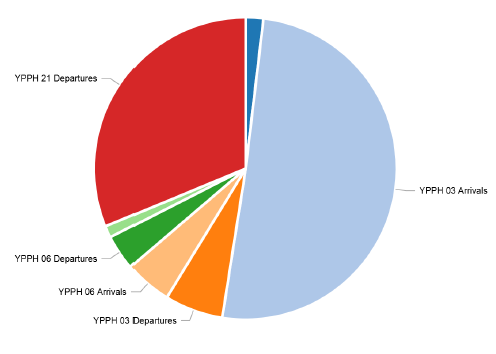
160 complainants were concerned about increased frequency of movements with the majority from suburbs affected by arrivals to Runway 03 and departures from Runway 21. During this quarter arrivals to Runway 03 were consistent with the previous quarter, with a small drop overall in Runway 03 use in May. Perth’s seasonal wind patterns play a role in how frequently a particular runway direction is used.
Chart 2: Breakdown of increased frequency issue
‘YPPH’ is the code for Perth Airport. 03, 06 and 21 are runway directions.
Complainants and suburbs
There were 547 complainants during the second quarter, a reduction from quarter one. For the year to date there have been 1196 “unique” complainants, that is, NCIS has been contacted by 1196 individuals.
This quarter there were 32 suburbs with five or more complainants. 103 complainants from Canning Vale were concerned about the data validation study while 47 were concerned about arrivals to Runway 03. Complainants concerned with departures from Runway 21 came from suburbs including Shelley (20), Riverton (12), Wilson (10), Mount Pleasant (7), Applecross (6), Salter Point (5) and Waterford (5).
Complainants from suburbs affected by arrivals from the south-west and departures to the south-west on the cross runway included Belmont (19), Rivervale (18), Victoria Park (14), Lathlain (14), Kensington (13), South Perth (13), Como (11) and Redcliffe (9).
Issues
There were 830 complainants during the first quarter.
483 complainants made contact about the data validation study. This short-term study was conducted to validate modelled noise data in the environmental assessment conducted for the proposed night-time respite departure flight path trial. More information about the proposed night-time respite flight path and data validation study is available on the Investigations page.
Chart 1: Data validation study
157 complainants were concerned about increased frequency of aircraft movements. During this quarter, the seasonal change in weather patterns resulted in the increase of arrivals to Runway 03 compared to the previous quarter. This was reflected in contacts from complainants affected by arrivals (from the south) to Runway 03.The south-western end of the crossing runway was also used for arrivals to Runway 06 due to the wind conditions which at times limited the ability to use the main runway due to strong crosswinds. As this runway end is used infrequently, this was particularly noticeable to residents.
Suburbs
This quarter the majority of complainants were against the data validation study and came from suburbs affected by the changed night-time departure route. Many of these same areas are affected by arrivals to Runway 03 and were therefore also affected by the seasonal increase in frequency of use of that runway. Some complainants mistook this typical seasonal increase for the data validation study and were confused about why they experienced traffic at times when the data validation study was not being run. These suburbs included Canning Vale (286), Beeliar (25), Yangebup (20), Success (17), Atwell (15), Jandakot (13), Aubin Grove (11), Parkwood (11), Munster (8), South Lake (8), Willetton (8), Bibra Lake (6), Harrisdale (5) and Spearwood (5).
Complainants from suburbs to the south-west of Perth Airport also made contact about the data validation study, but were in favour of it or were asking for it to be made permanent. These suburbs included Shelley (48), Wilson (19), Riverton (18), Salter Point (18), Mount Pleasant (15), Manning (13), and Applecross (10).
Residents affected by cross-runway usage included Victoria Park (9), Kensington (8), Rivervale (7), and Belmont (5).