Circuit Training
Circuit training is the first stage of practical pilot training focused on take-offs and landings. It involves the pilot making approaches to the runway or helipad, touching down and then applying power to take off again. This is undertaken in accordance with Civil Aviation Safety Authority (CASA) Regulations which are consistent with international practices.
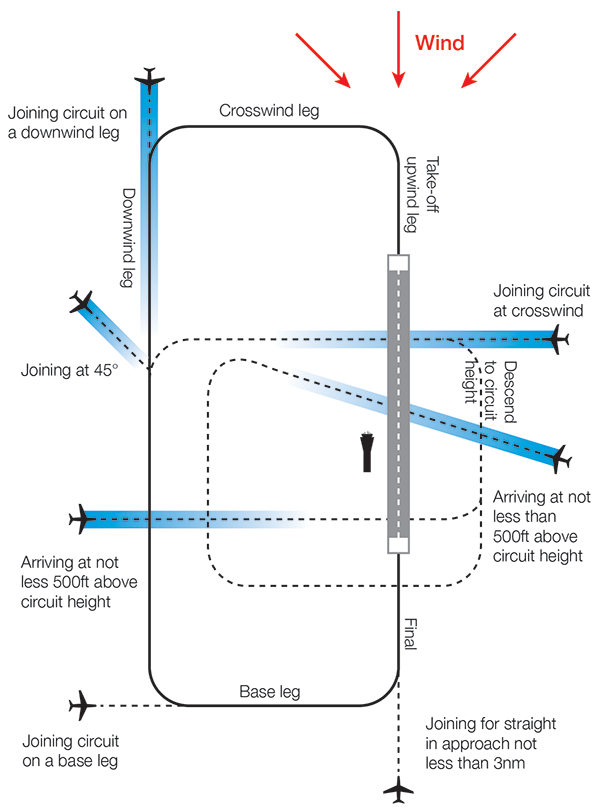
A training circuit consists of five legs – take-off, crosswind, downwind, base and final approach to the runway.
Aircraft take off into the wind, climb to 500 feet and then turn onto the crosswind leg. They continue to ascend to 1000 feet and turn onto the downwind leg. Having turned onto the base leg the descent commences. After turning onto the final leg and lining up with the runway the aircraft will touch down and take off again.
Helicopters circuit inside the fixed wing circuit at a lower altitude. When helicopters are training, the fixed wing pilots must extend the take-off leg by one nautical mile to increase the separation between the two types of aircraft. This has the effect of extending the area overflown.
Because Parafield Airport has two sets of parallel runways, this allows two circuits to operate at once. “Left-hand” circuits will be conducted from the left parallel runway, and “right-hand” circuits from the right runway. For left-hand circuits, the pilot turns left after take-off and flies anticlockwise. For right-hand circuit, the pilot turns right and flies in a clockwise direction.
A simplified representation of a left-hand circuit is shown at right. The take off and final stage of the circuit is flown into the wind, as this is the safest way for an aircraft to operate. The aircraft symbols and dotted lines indicate recommended ways for an aircraft to join the circuit pattern. Click the image to enlarge it, and use your browser “Back” button to return to this page.
As twin engine aircraft are generally faster than single engine aircraft, both types are generally, but not always, separated. When using the main runways, Runways 03/21, twin engine aircraft generally operate to the west and single engine aircraft to the east.
When winds dictate use of Runways 08/26 twin engine aircraft generally circuit to the north and single engine aircraft to the south.
Parafield Airport’s voluntary Fly Friendly Program asks signatories to keep circuits as narrow as possible. However, because the student pilots performing circuits are so new to flying, this is not always achievable.
More information about circuit training is found here.
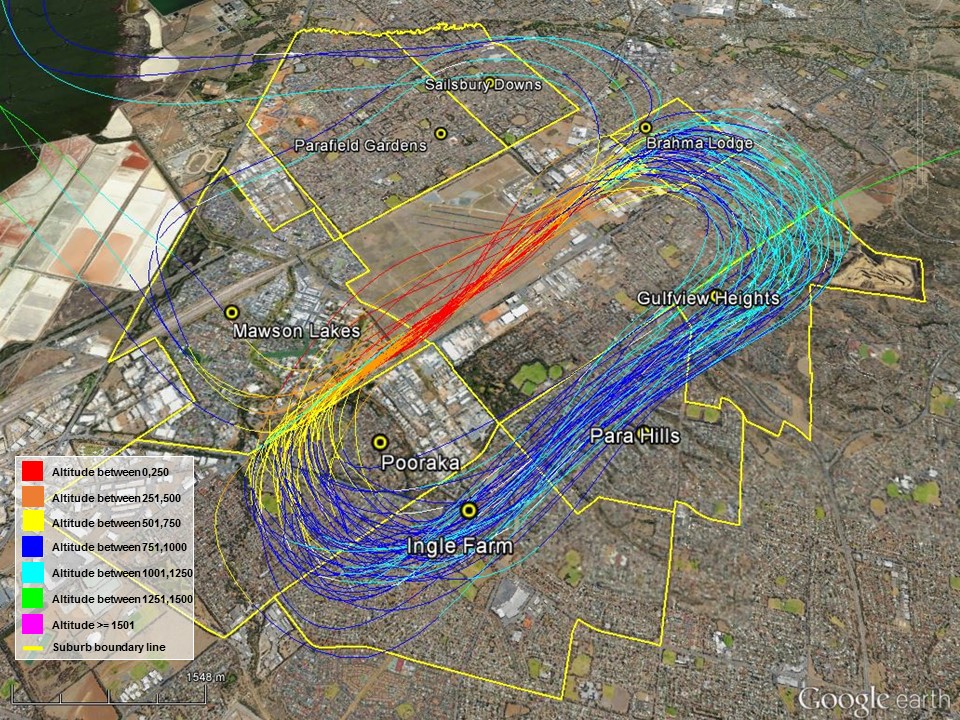
Aircraft aim to fly at 1000 feet on the downwind leg. Helicopters will fly at 800 feet to separate them from the fixed wing aircraft which will usually fly faster. Note that these altitudes apply only to the downwind leg. This is because aircraft are ascending on the take-off and crosswind legs and descending on the base and final legs.
While attaining 1000 feet on the downwind leg is the aim, in reality the altitudes of aircraft that are conducting circuit training will always vary. Part of the reason for this is that the trainees are new to flying and factors such as their level of experience and even their degree of nervousness will affect the altitudes they can achieve. Unfortunately the nature of circuit training is to teach new pilots and therefore this variation cannot be avoided.
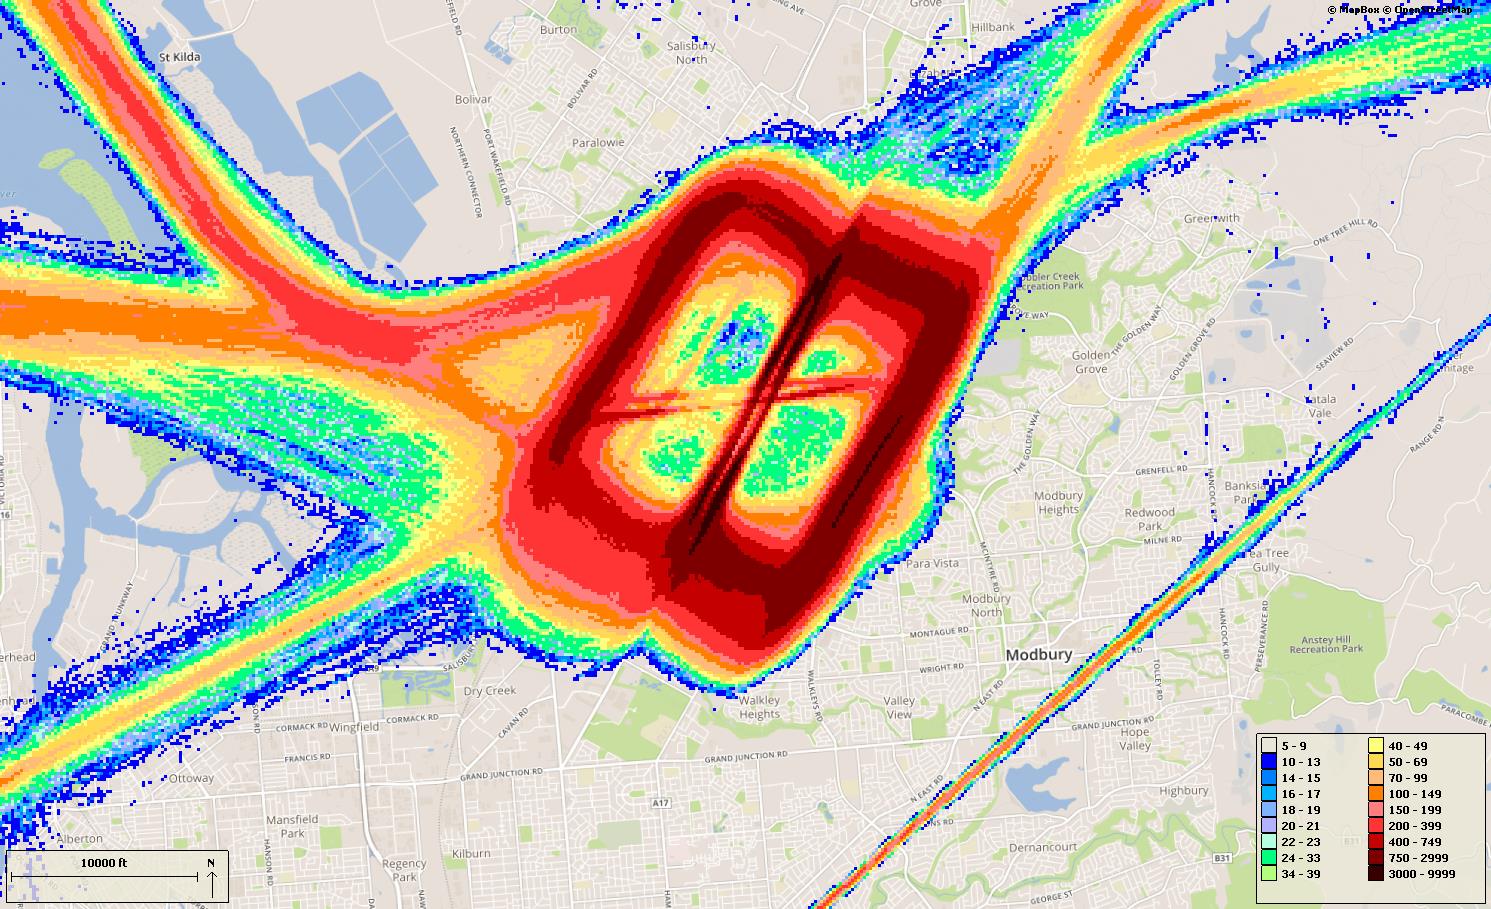
The tracks in the following images are coloured according to altitude:
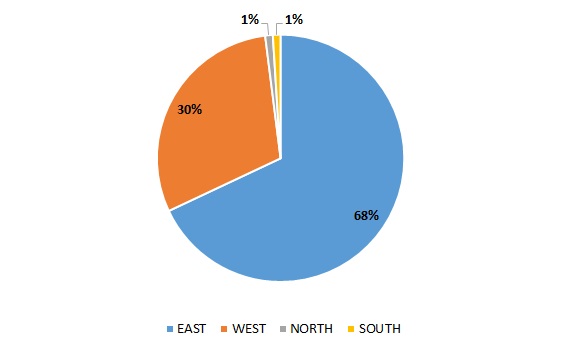
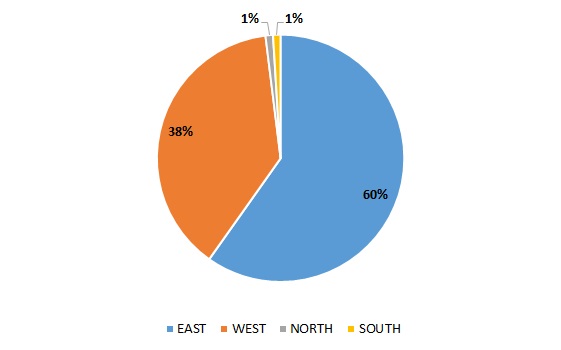
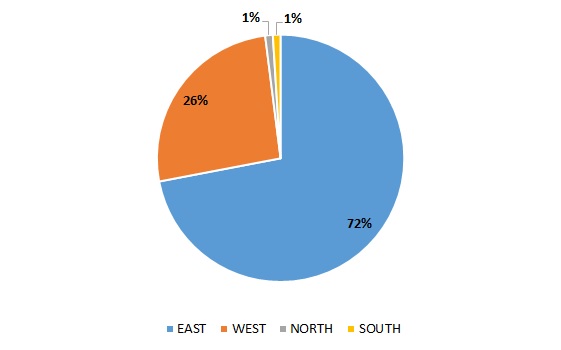
Select a quarter to see charts showing a breakdown of which side of the airport circuits were conducted in that period. The breakdowns are shown as percentages rather than total counts. This is because the source radar data for Parafield Airport has gaps due to the radar being located at Adelaide Airport. As these gaps occur randomly throughout the day, the data, while incomplete, provides a representative picture of the distribution of circuits.
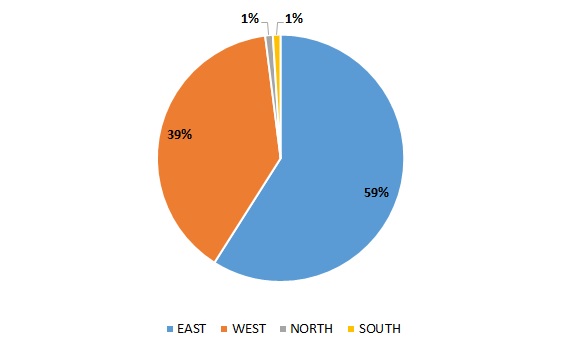
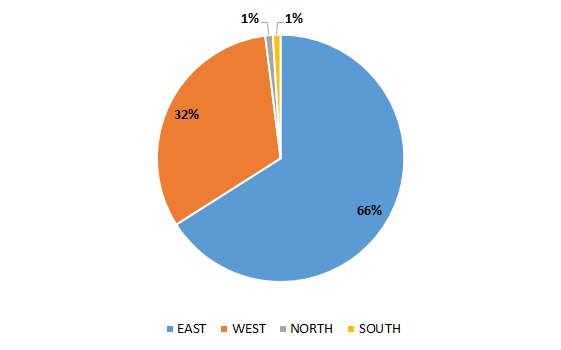
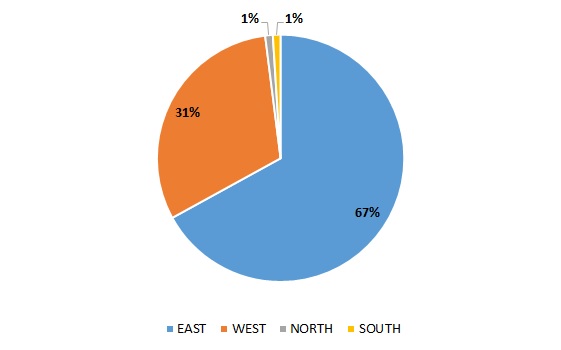
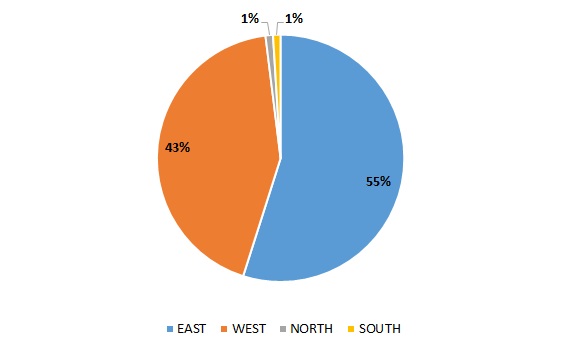
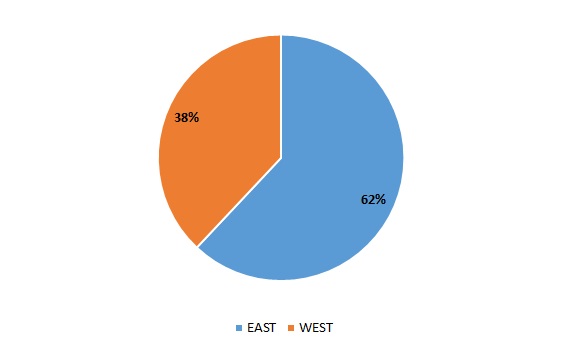
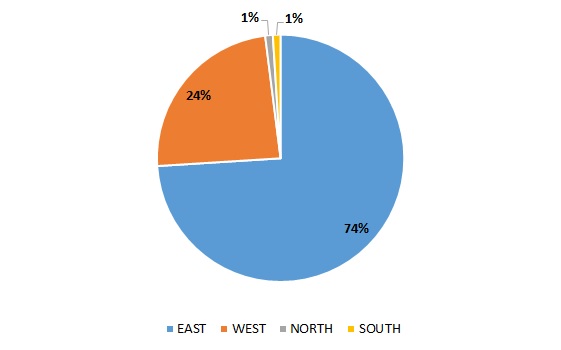
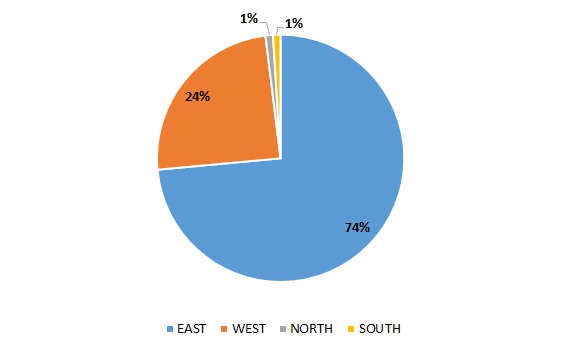
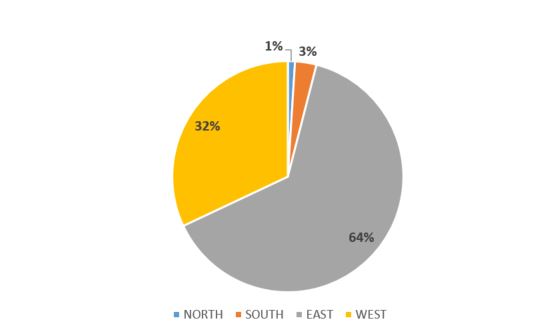
Percentage of circuits on each side of the airport (north/south/east/west)
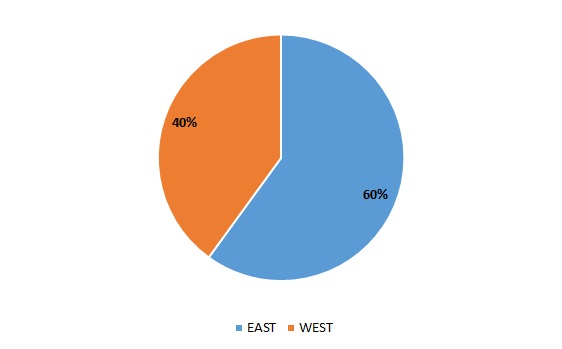
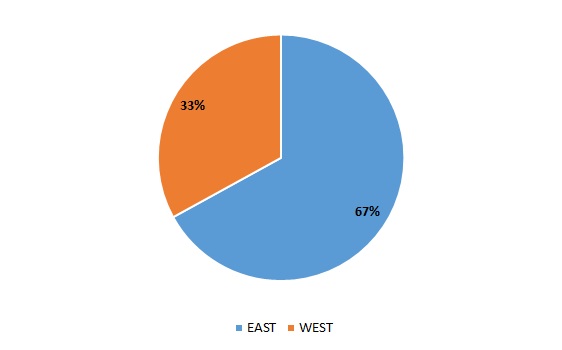
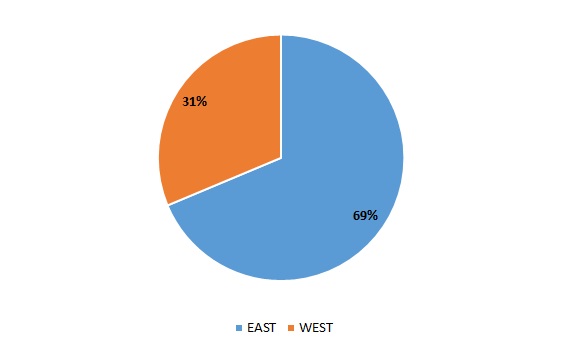
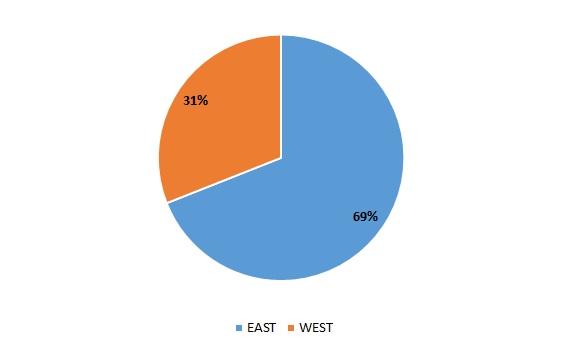
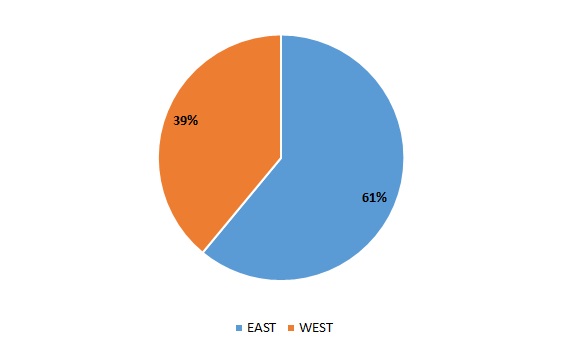
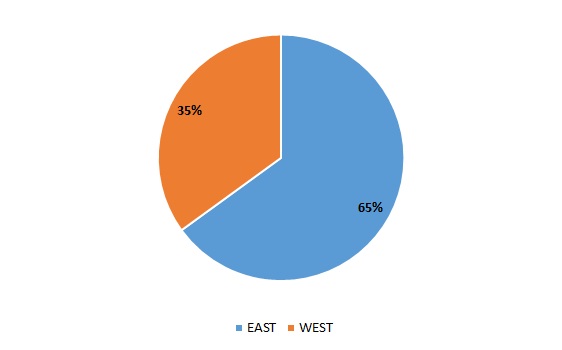
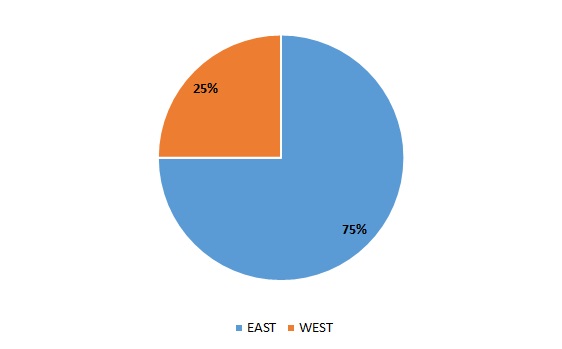
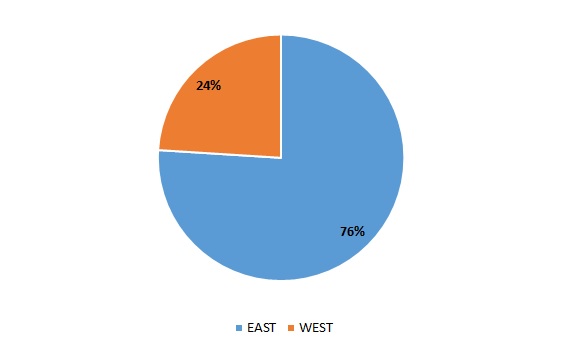
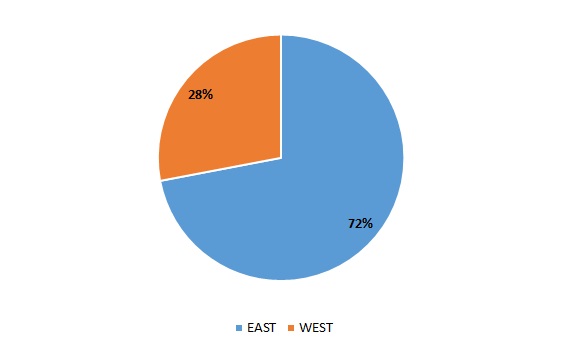
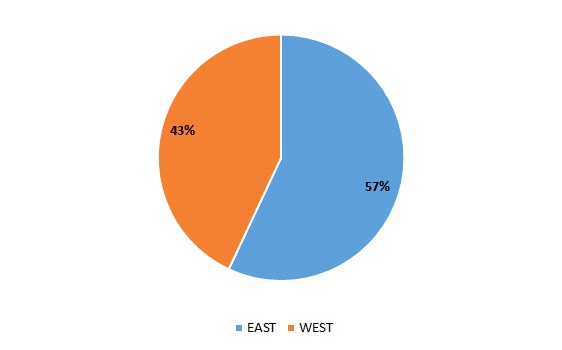
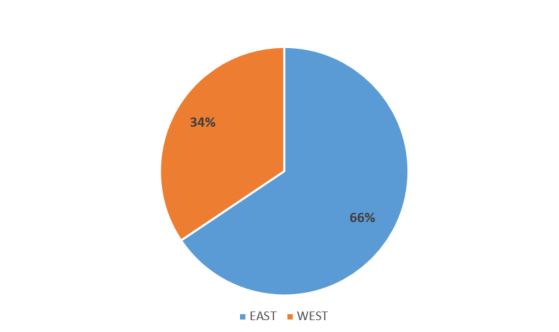
Comparison of percentage of circuits to the east versus west
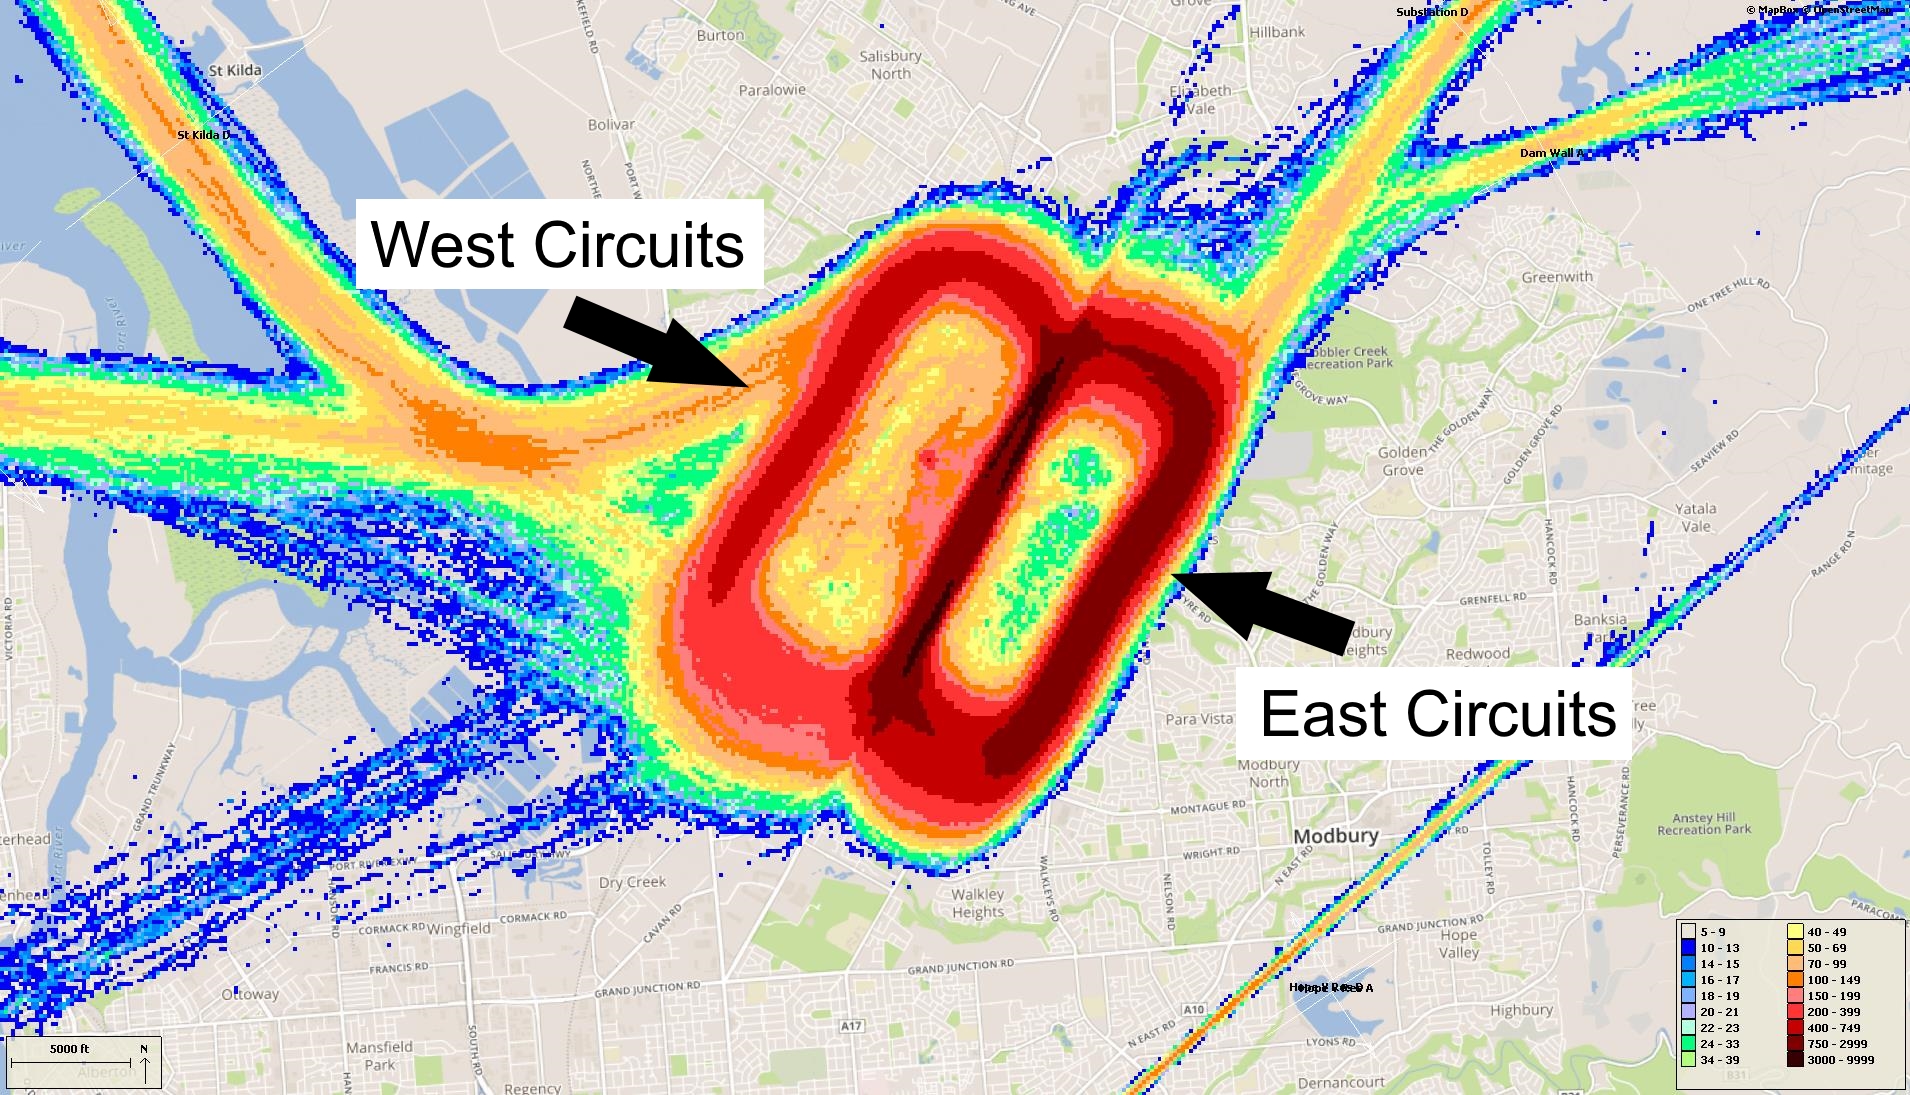
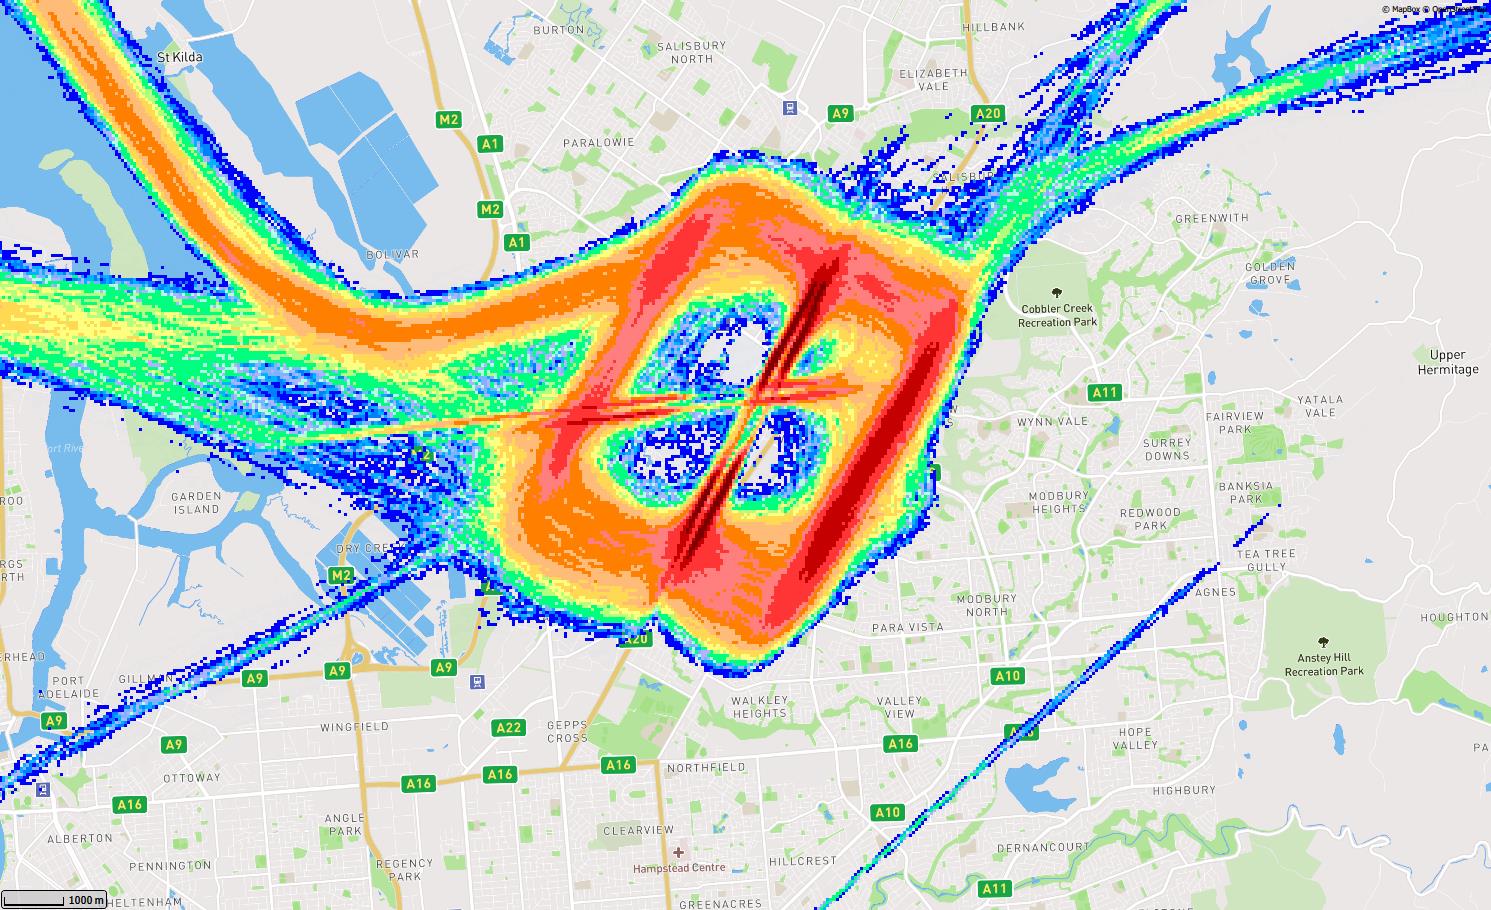
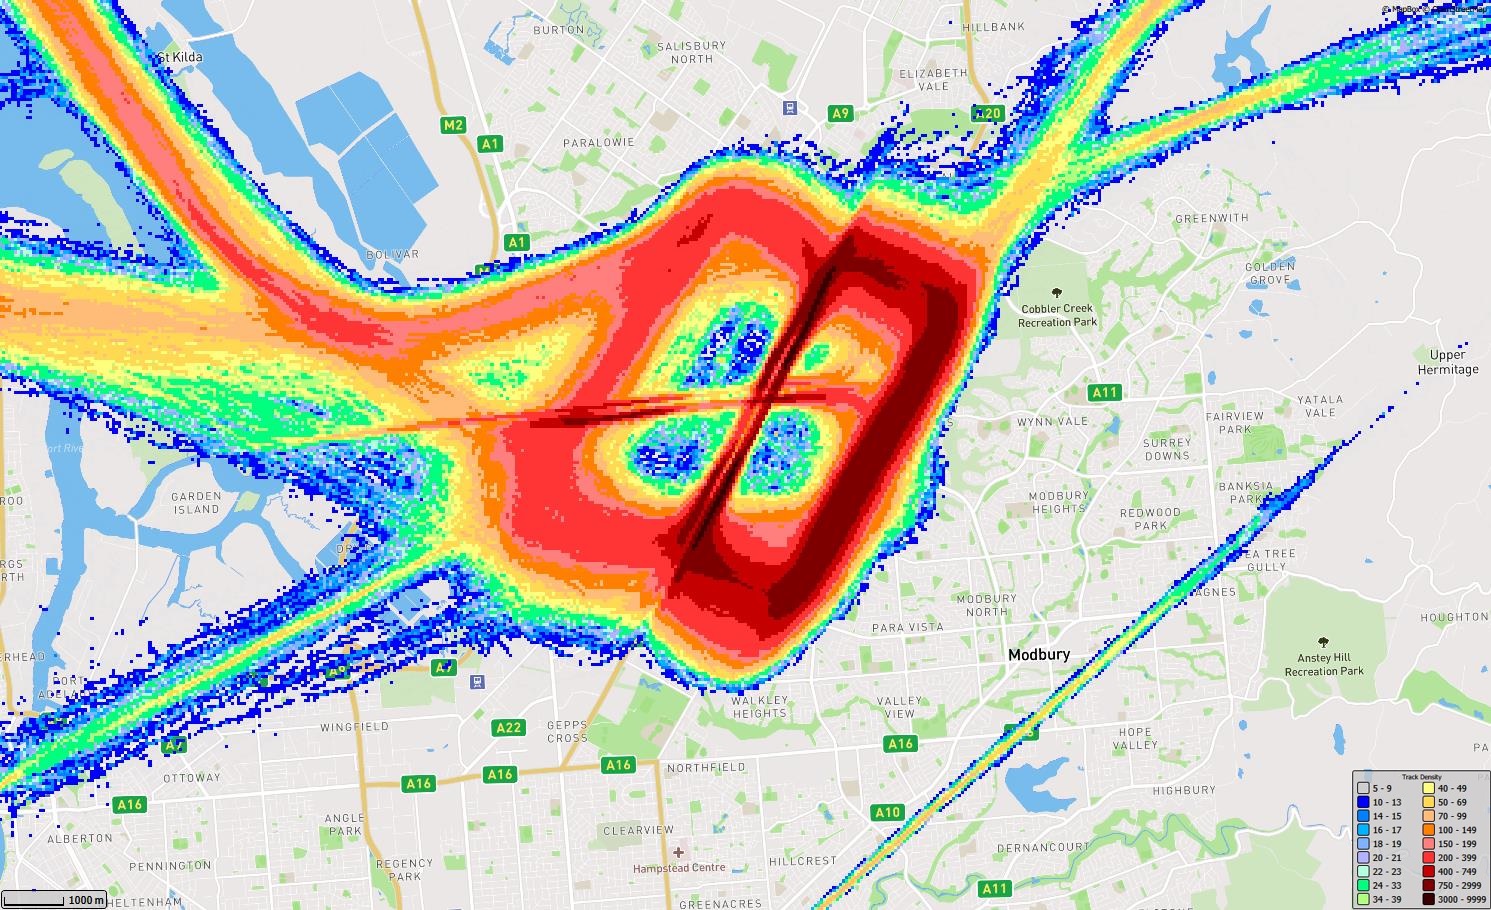
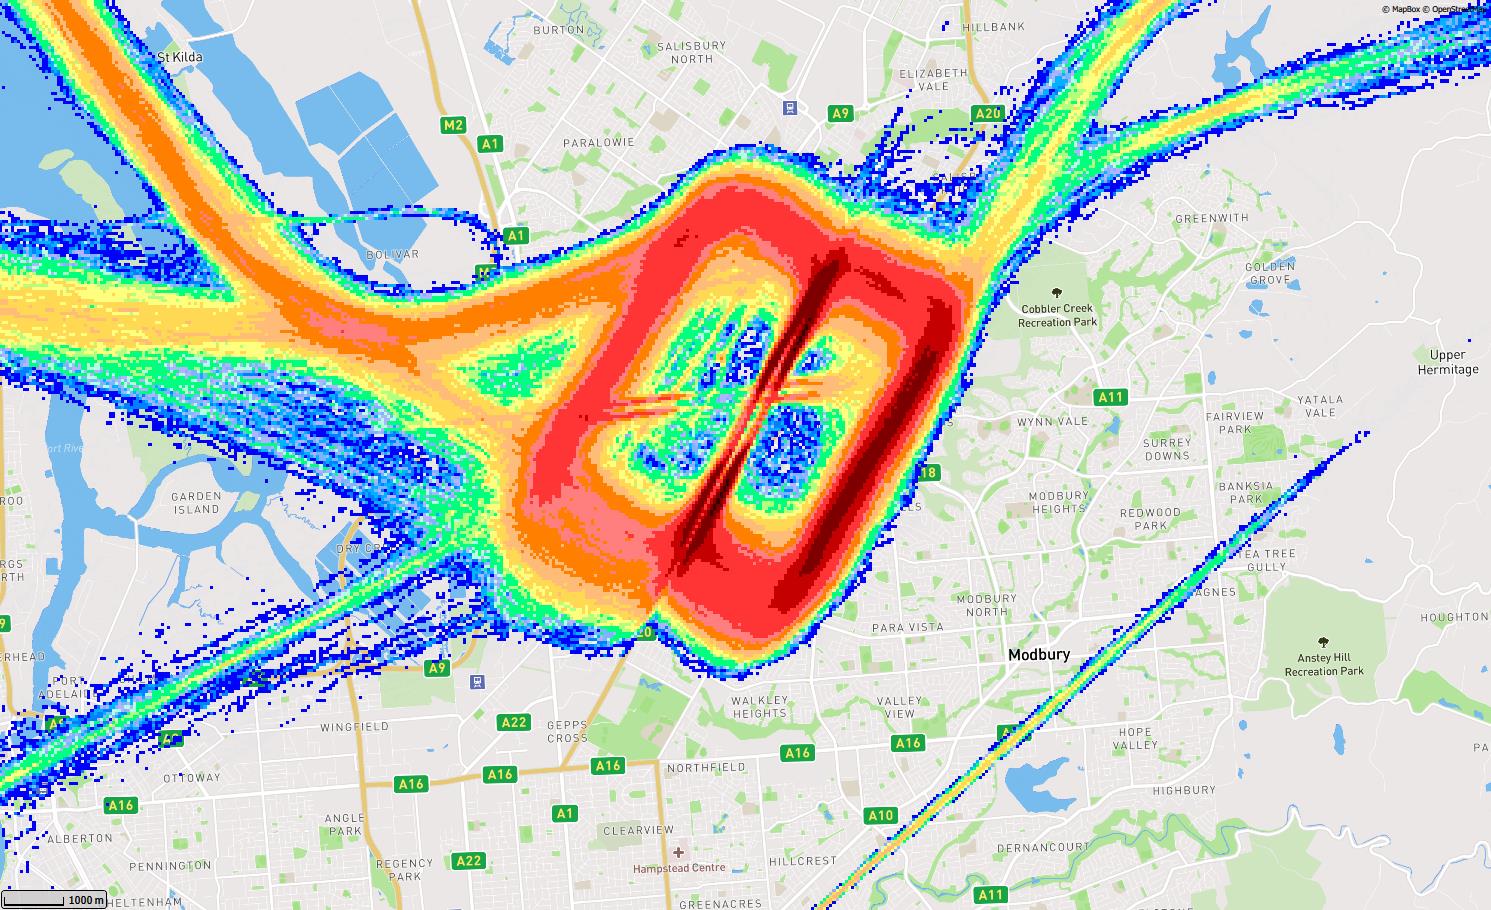
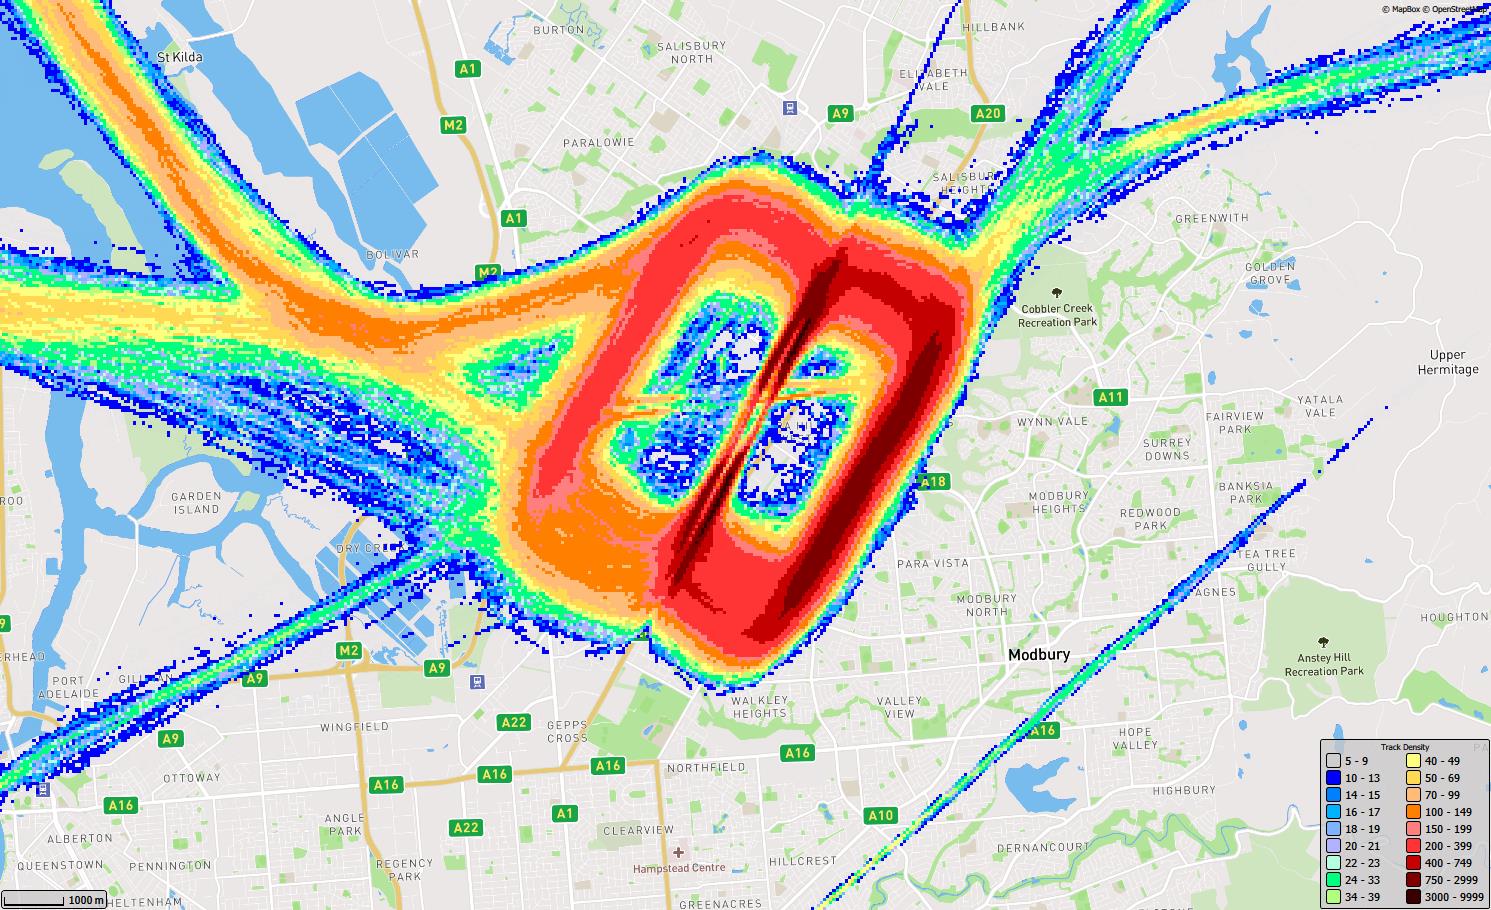
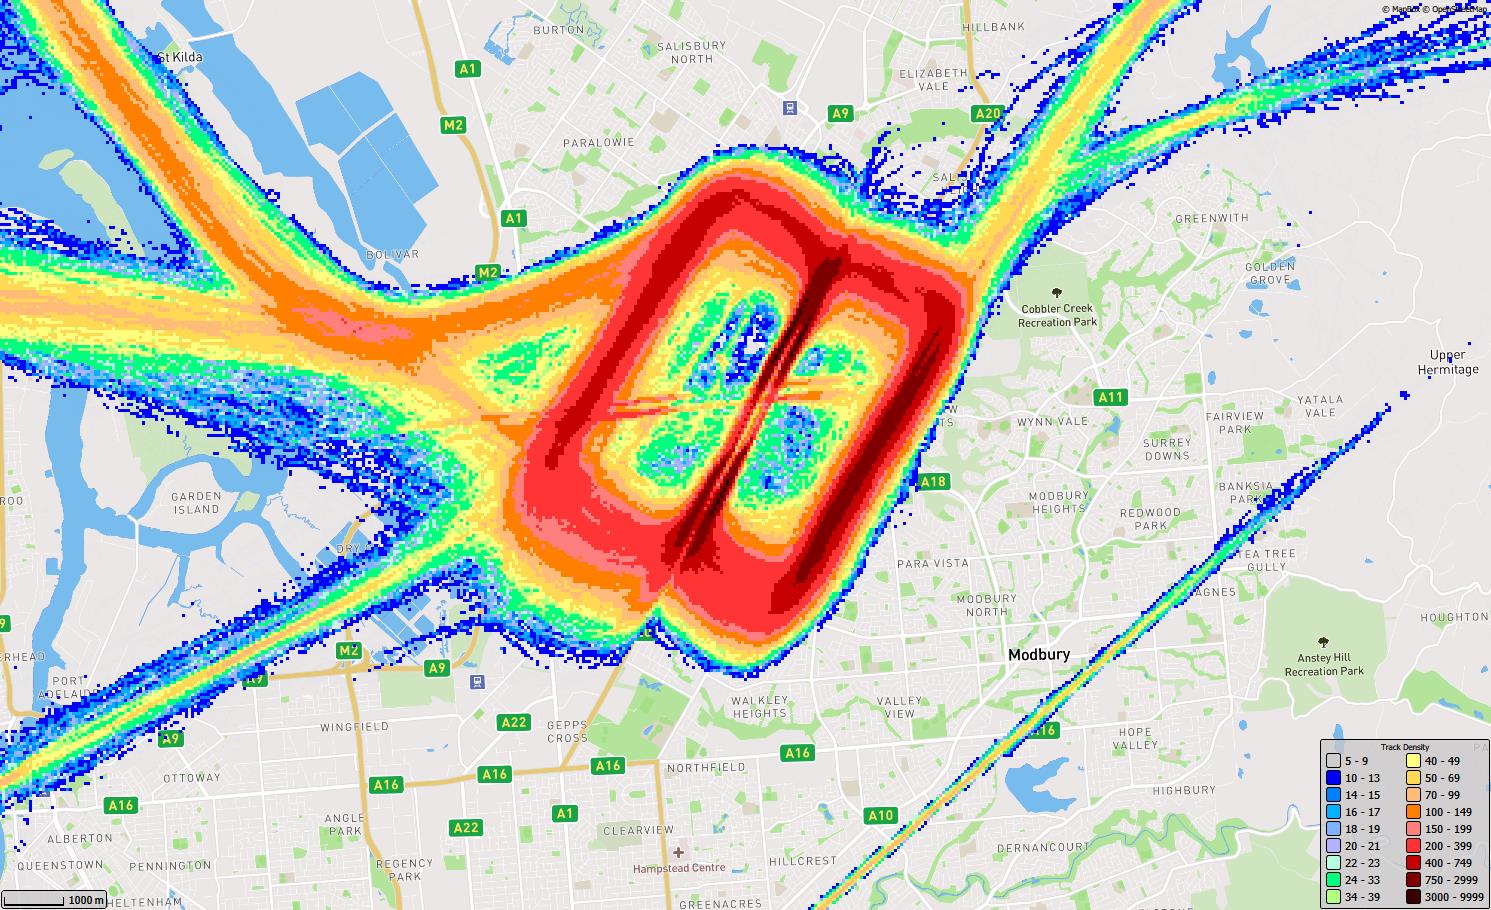
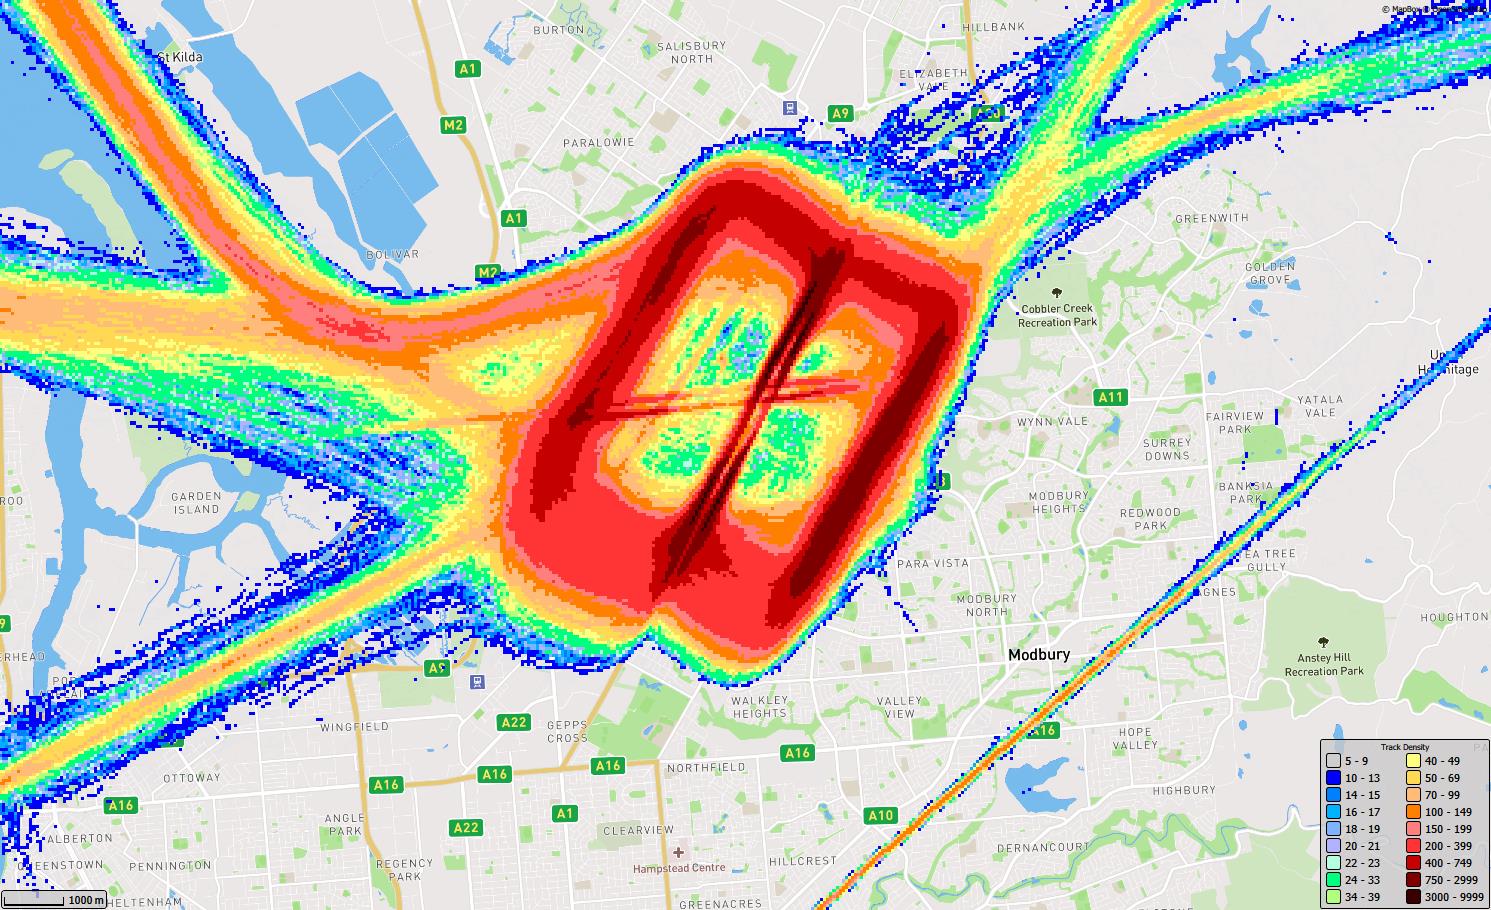
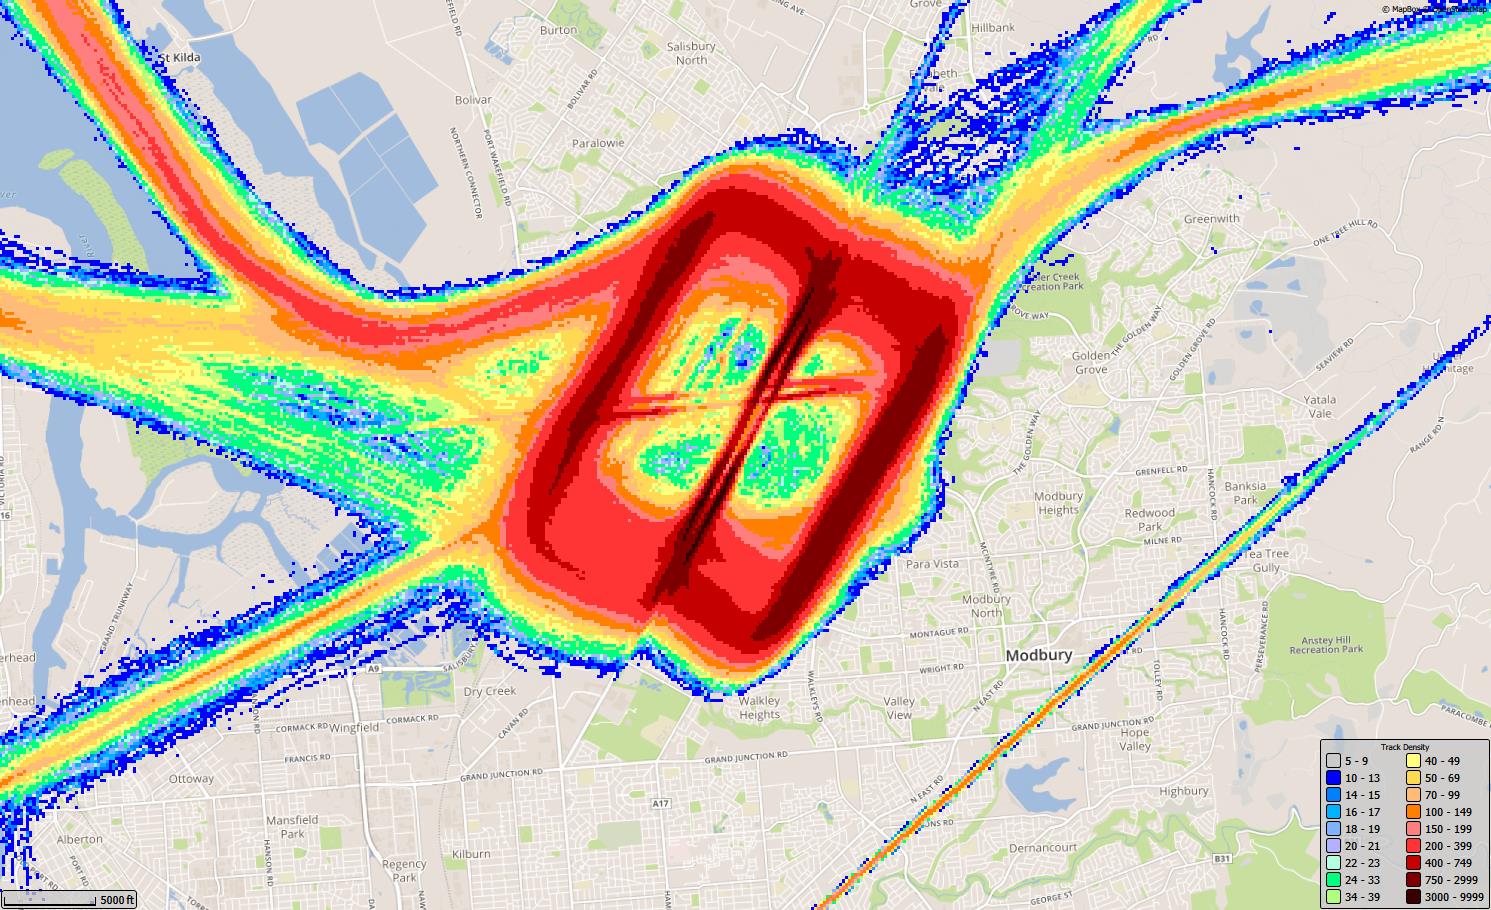
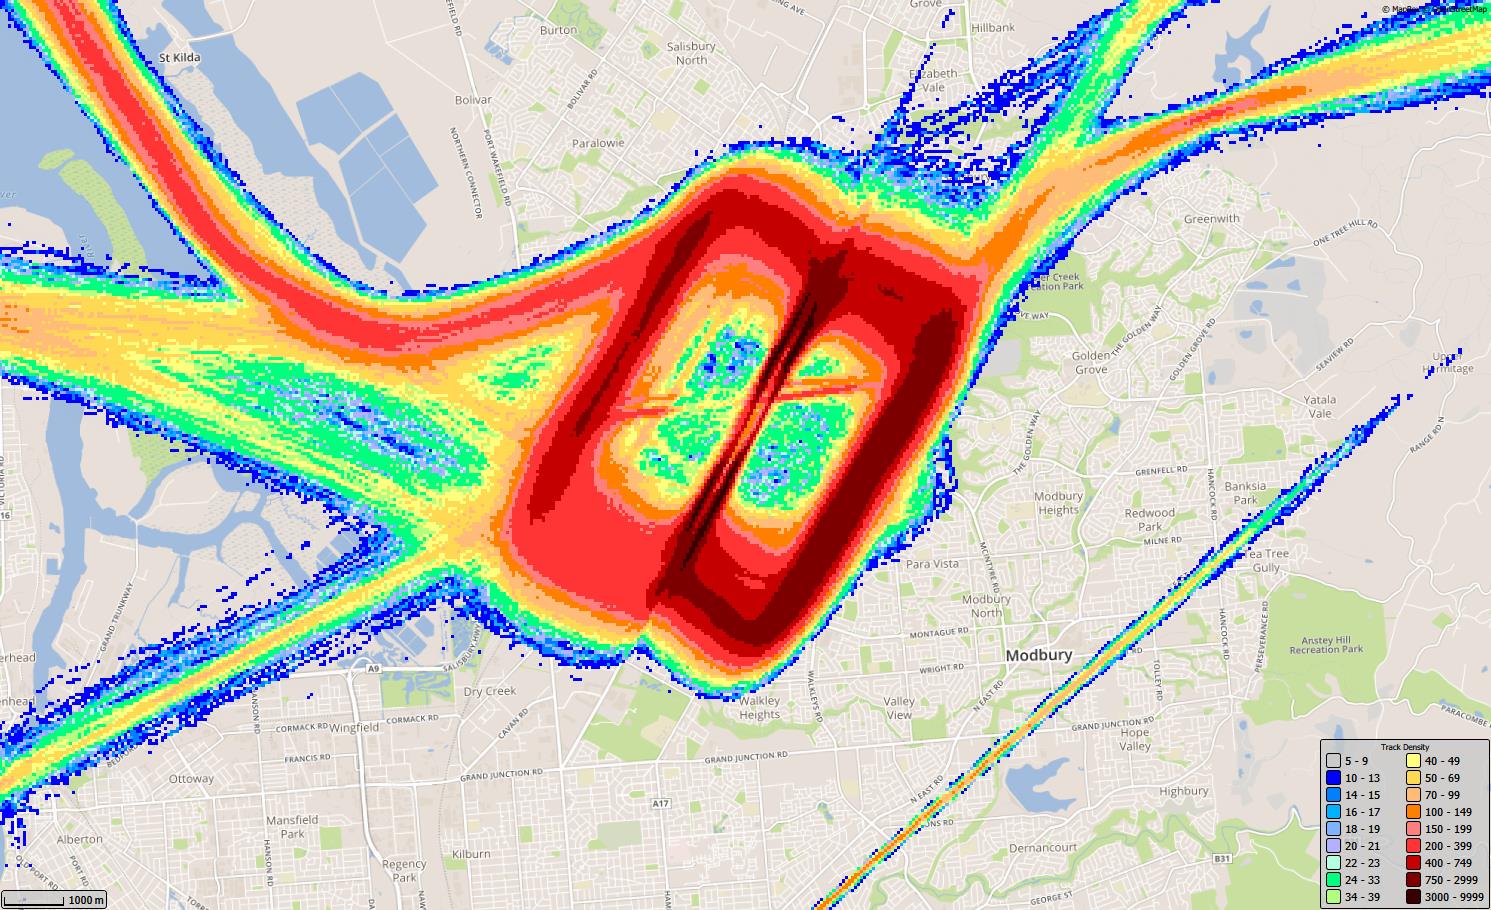
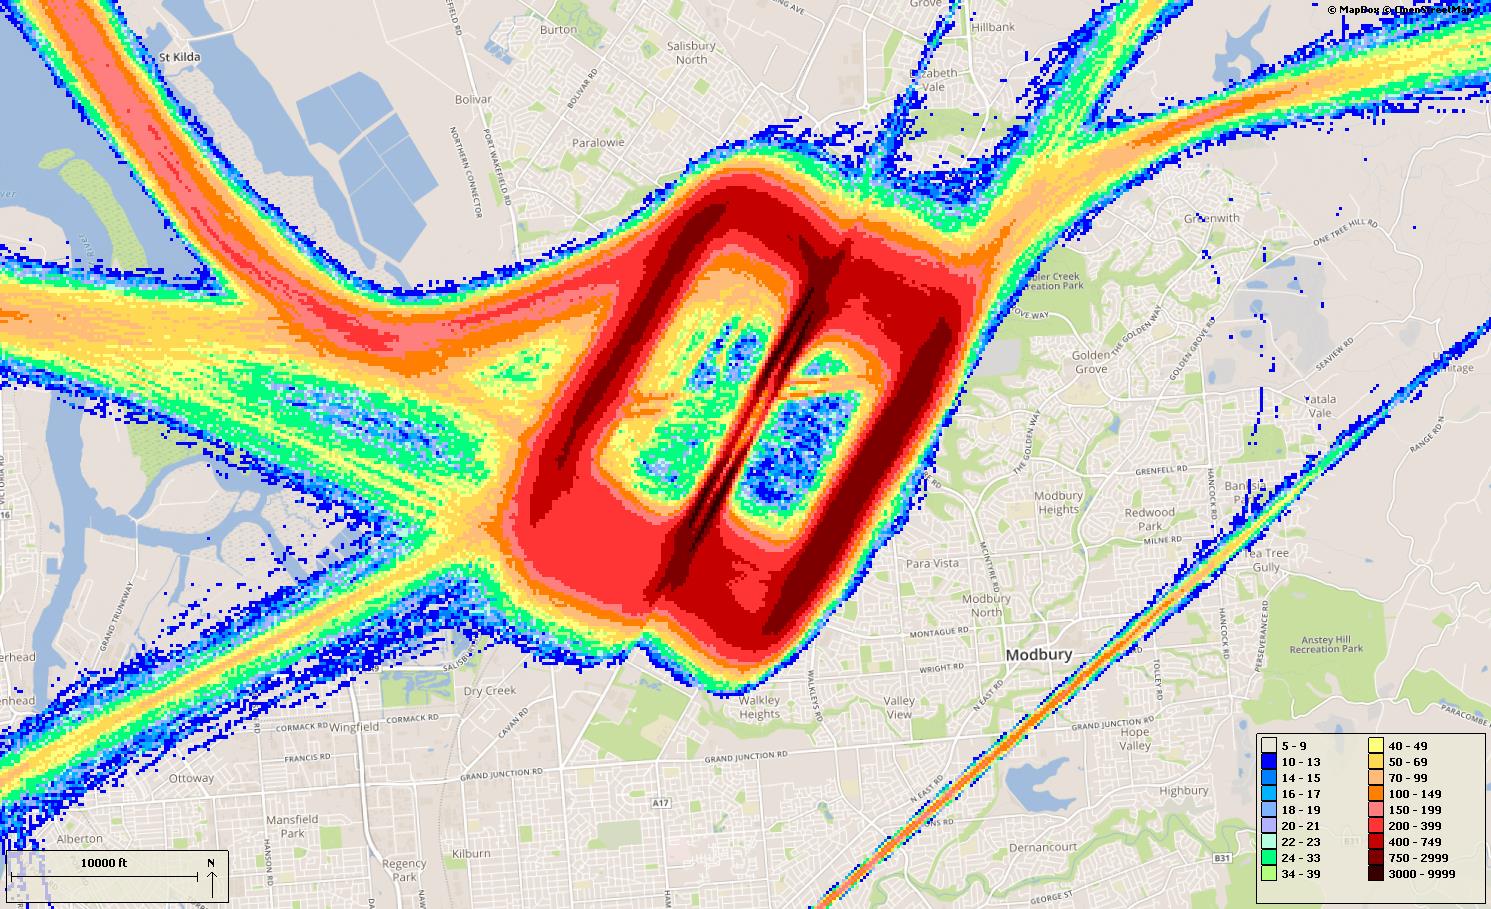
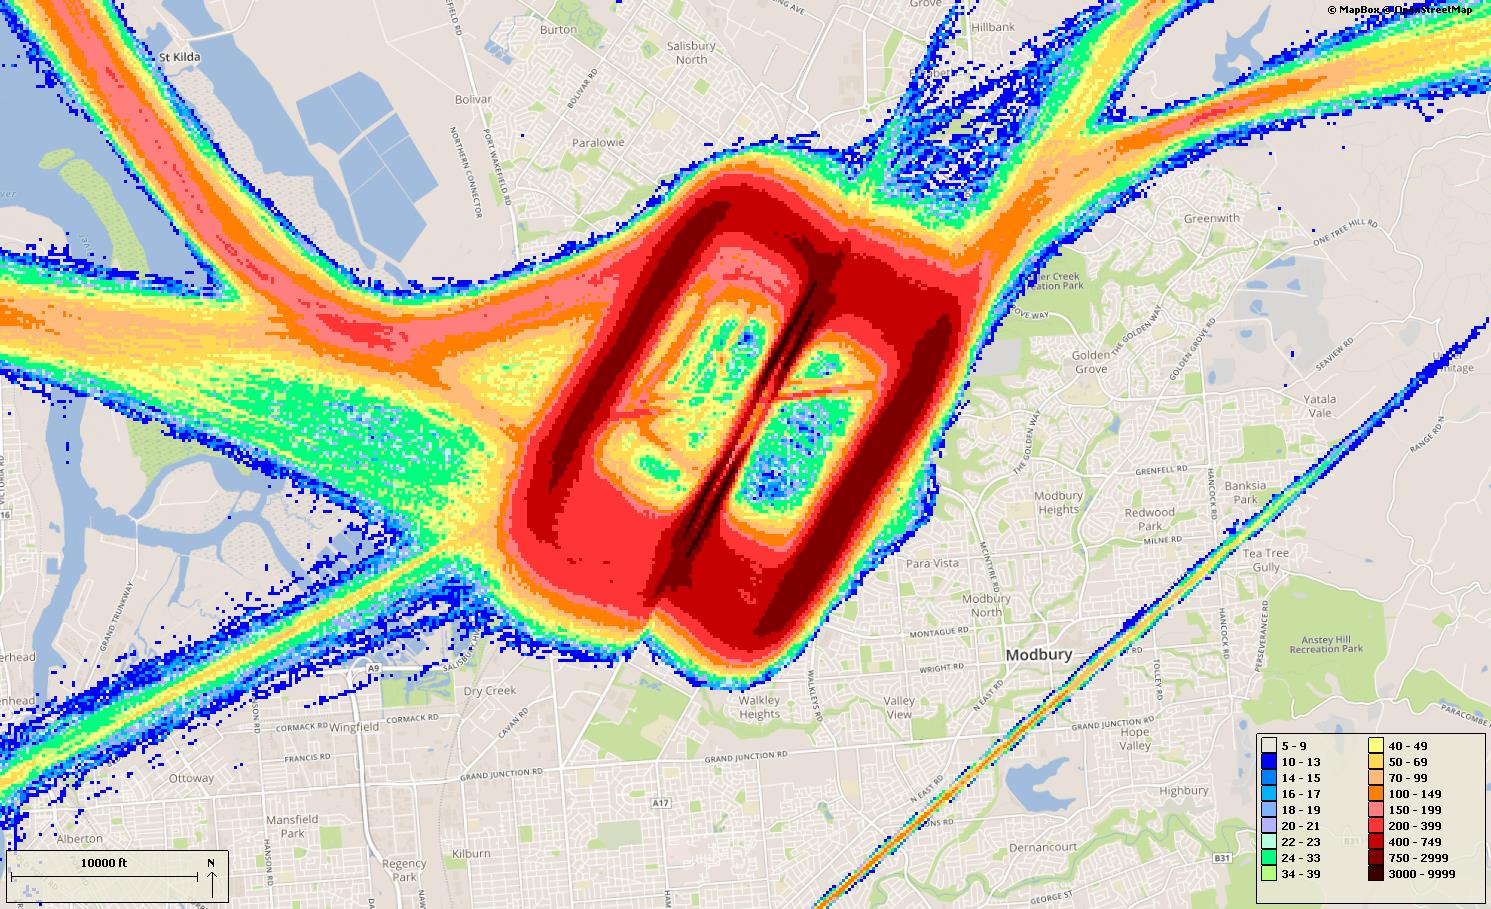
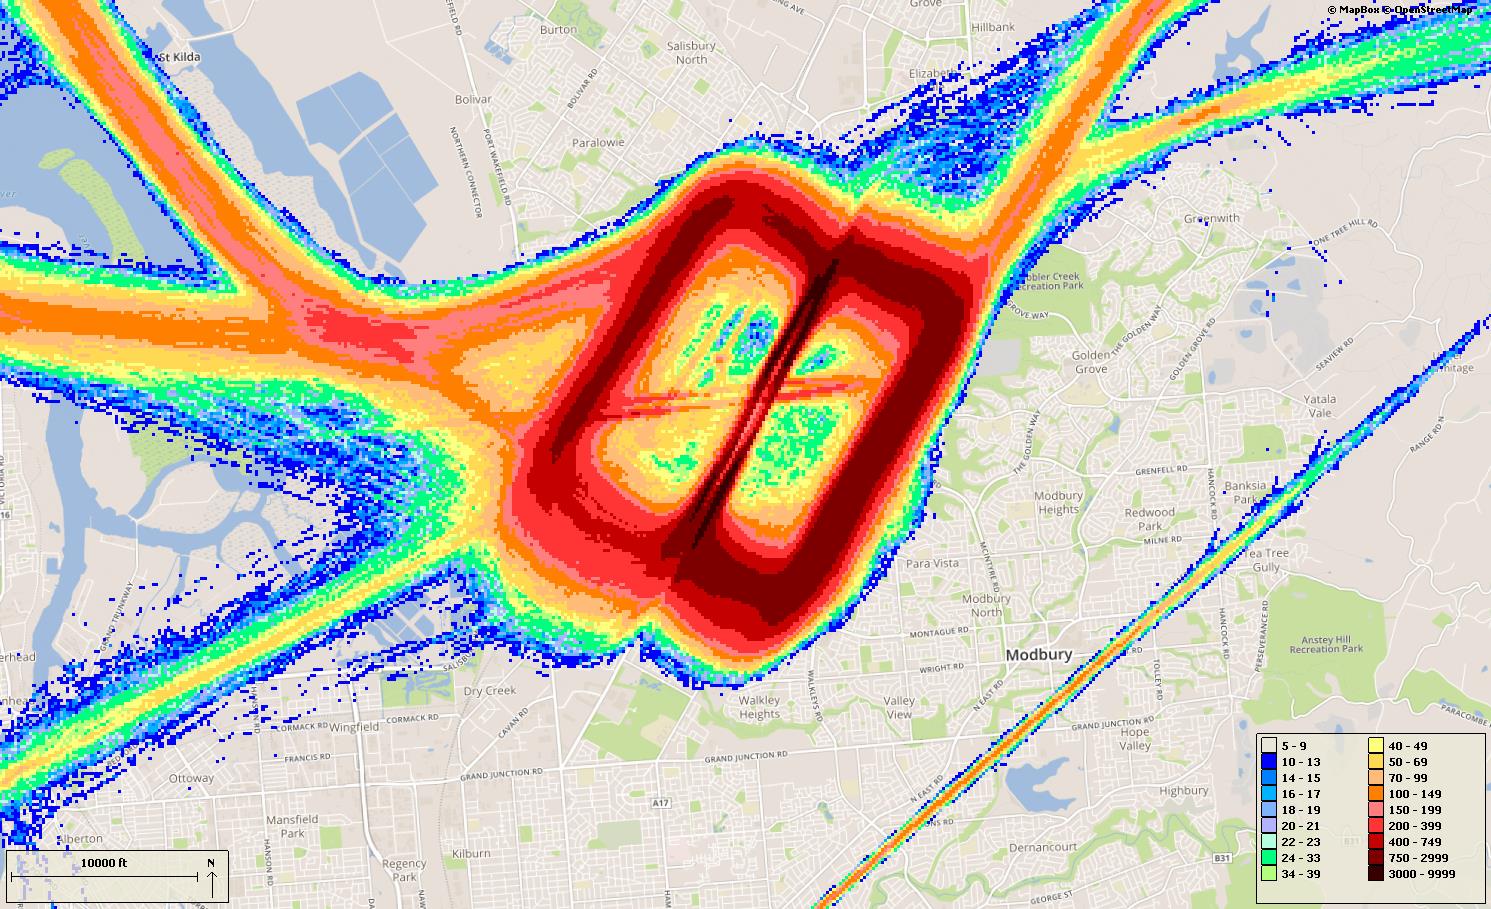
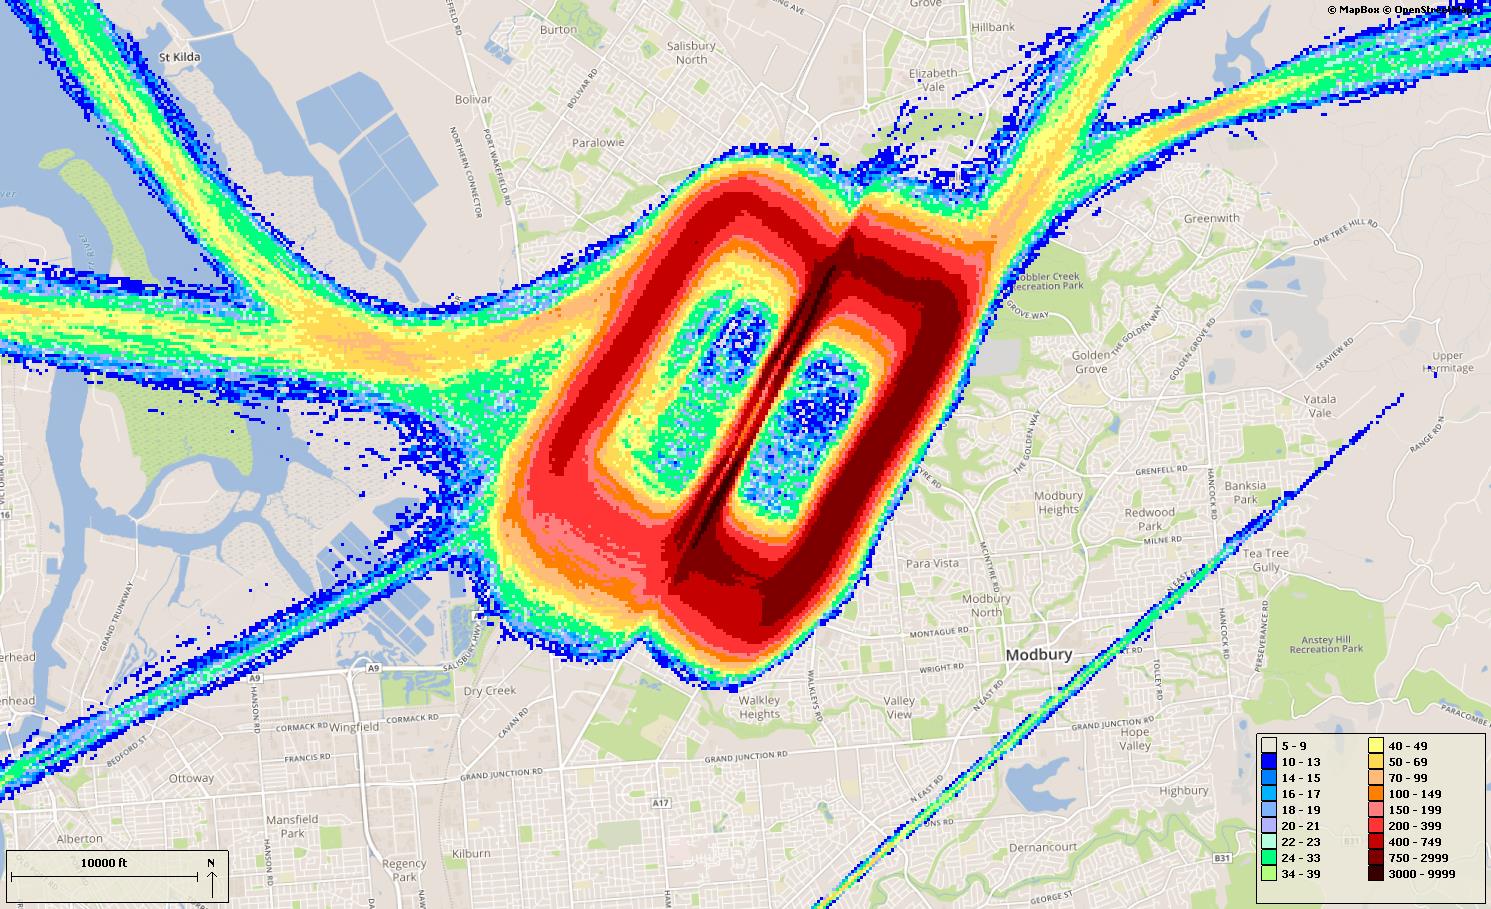
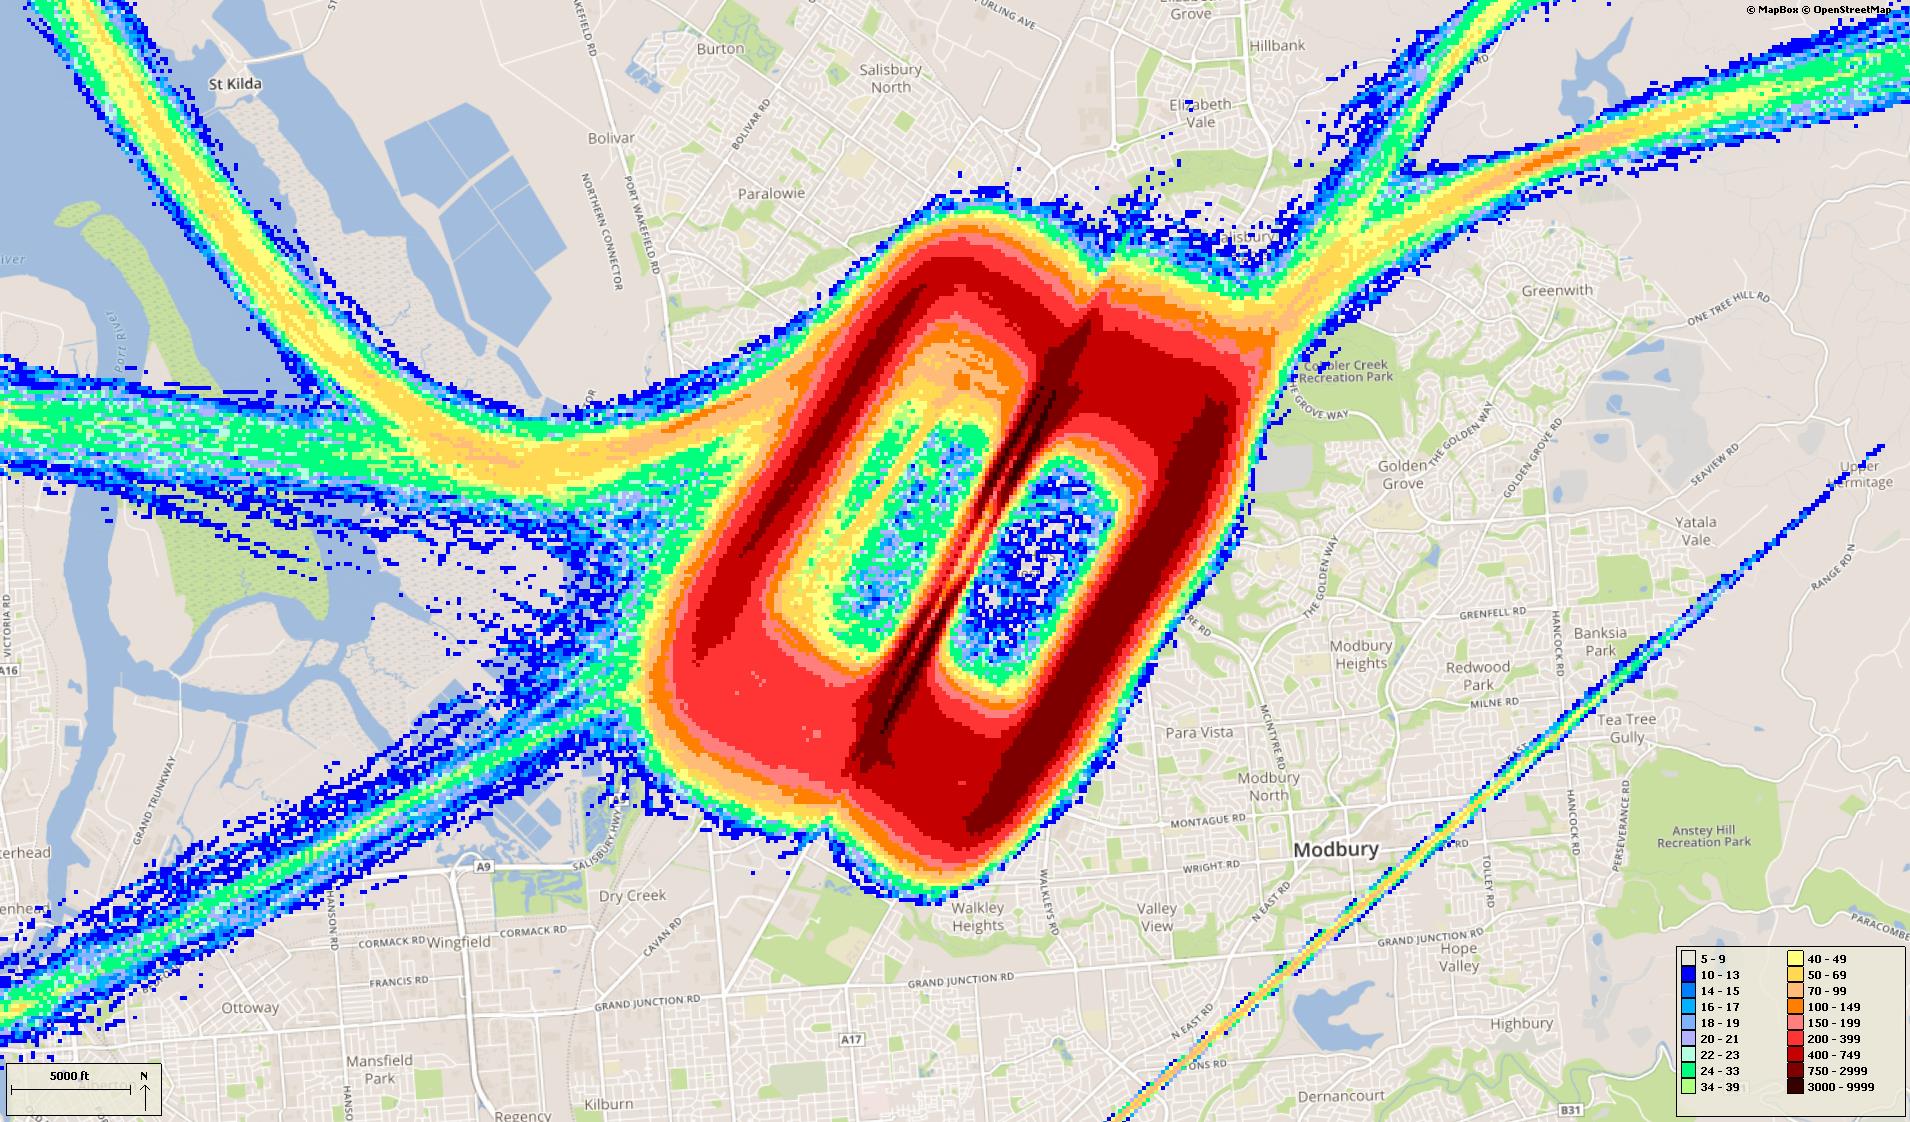
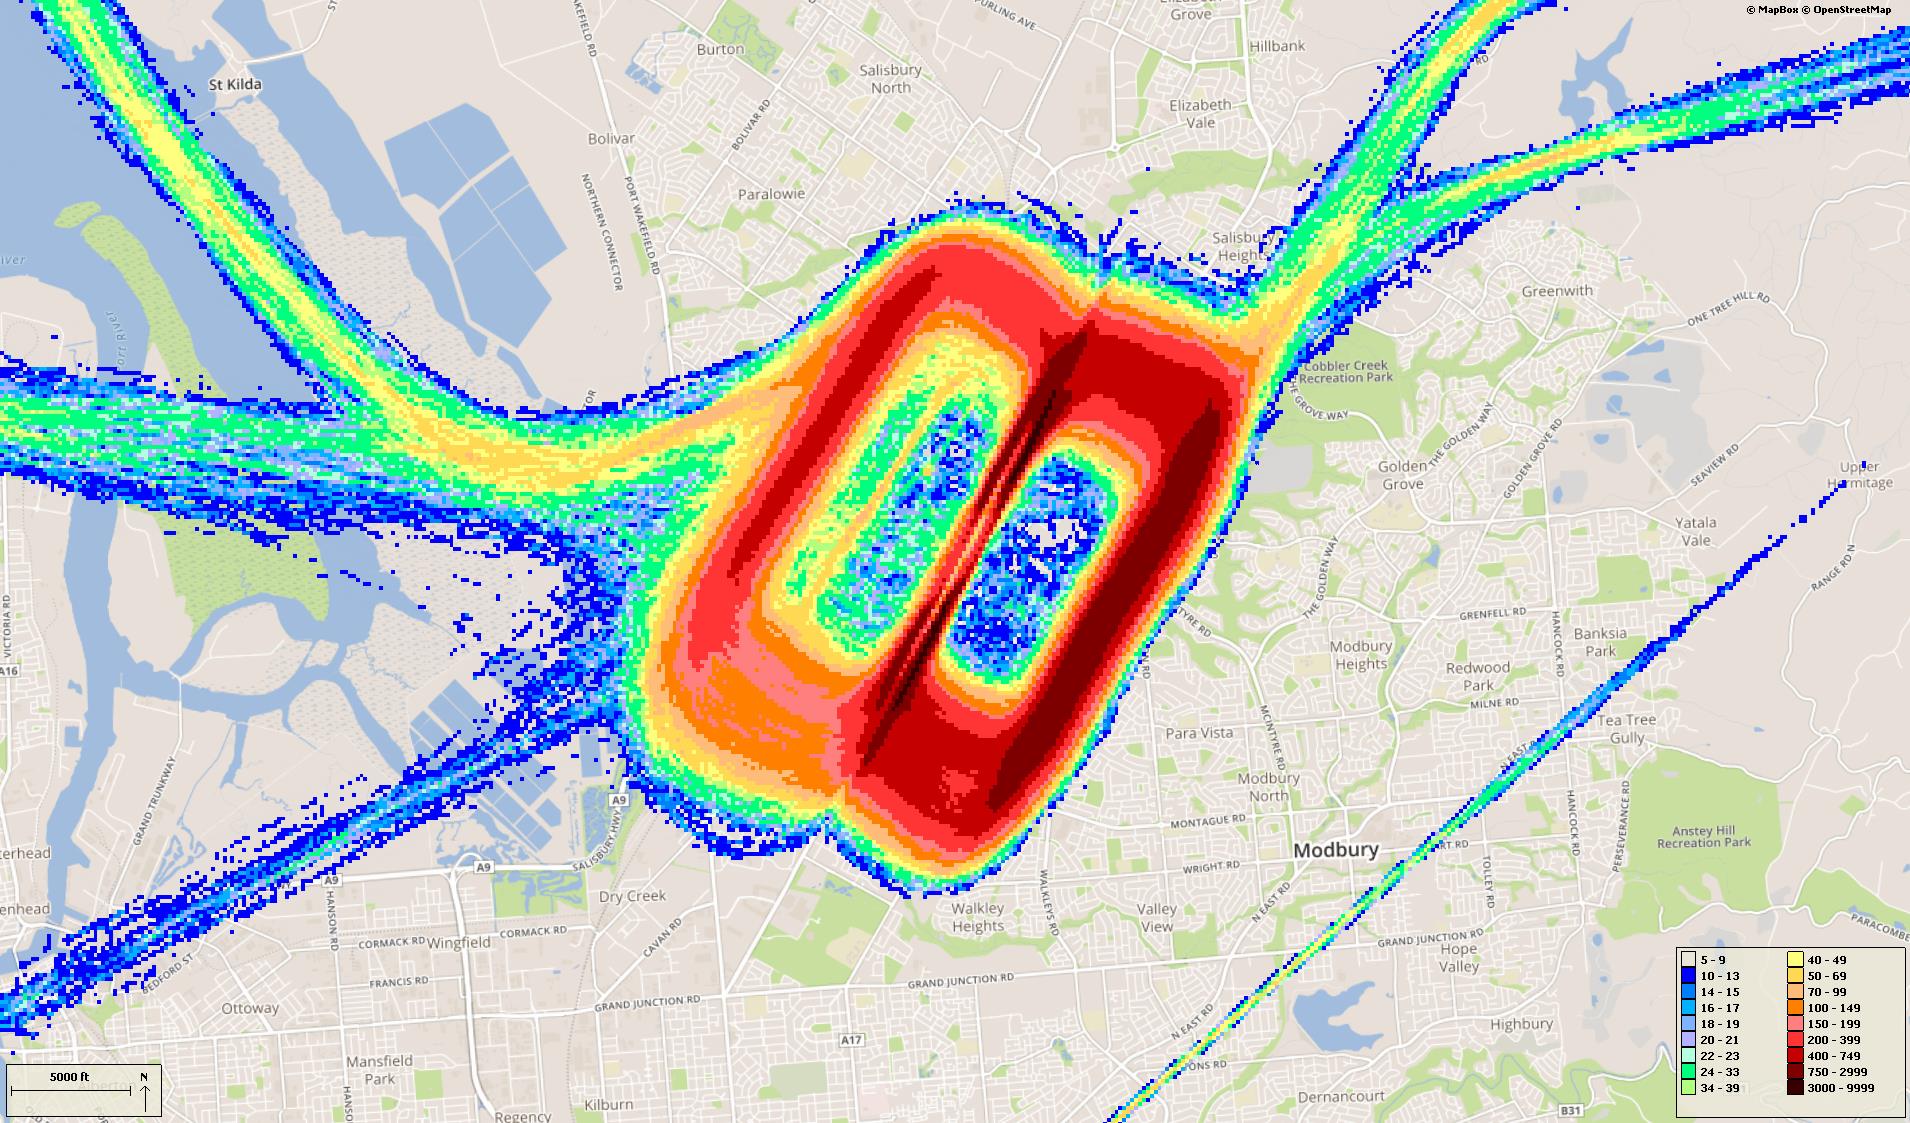
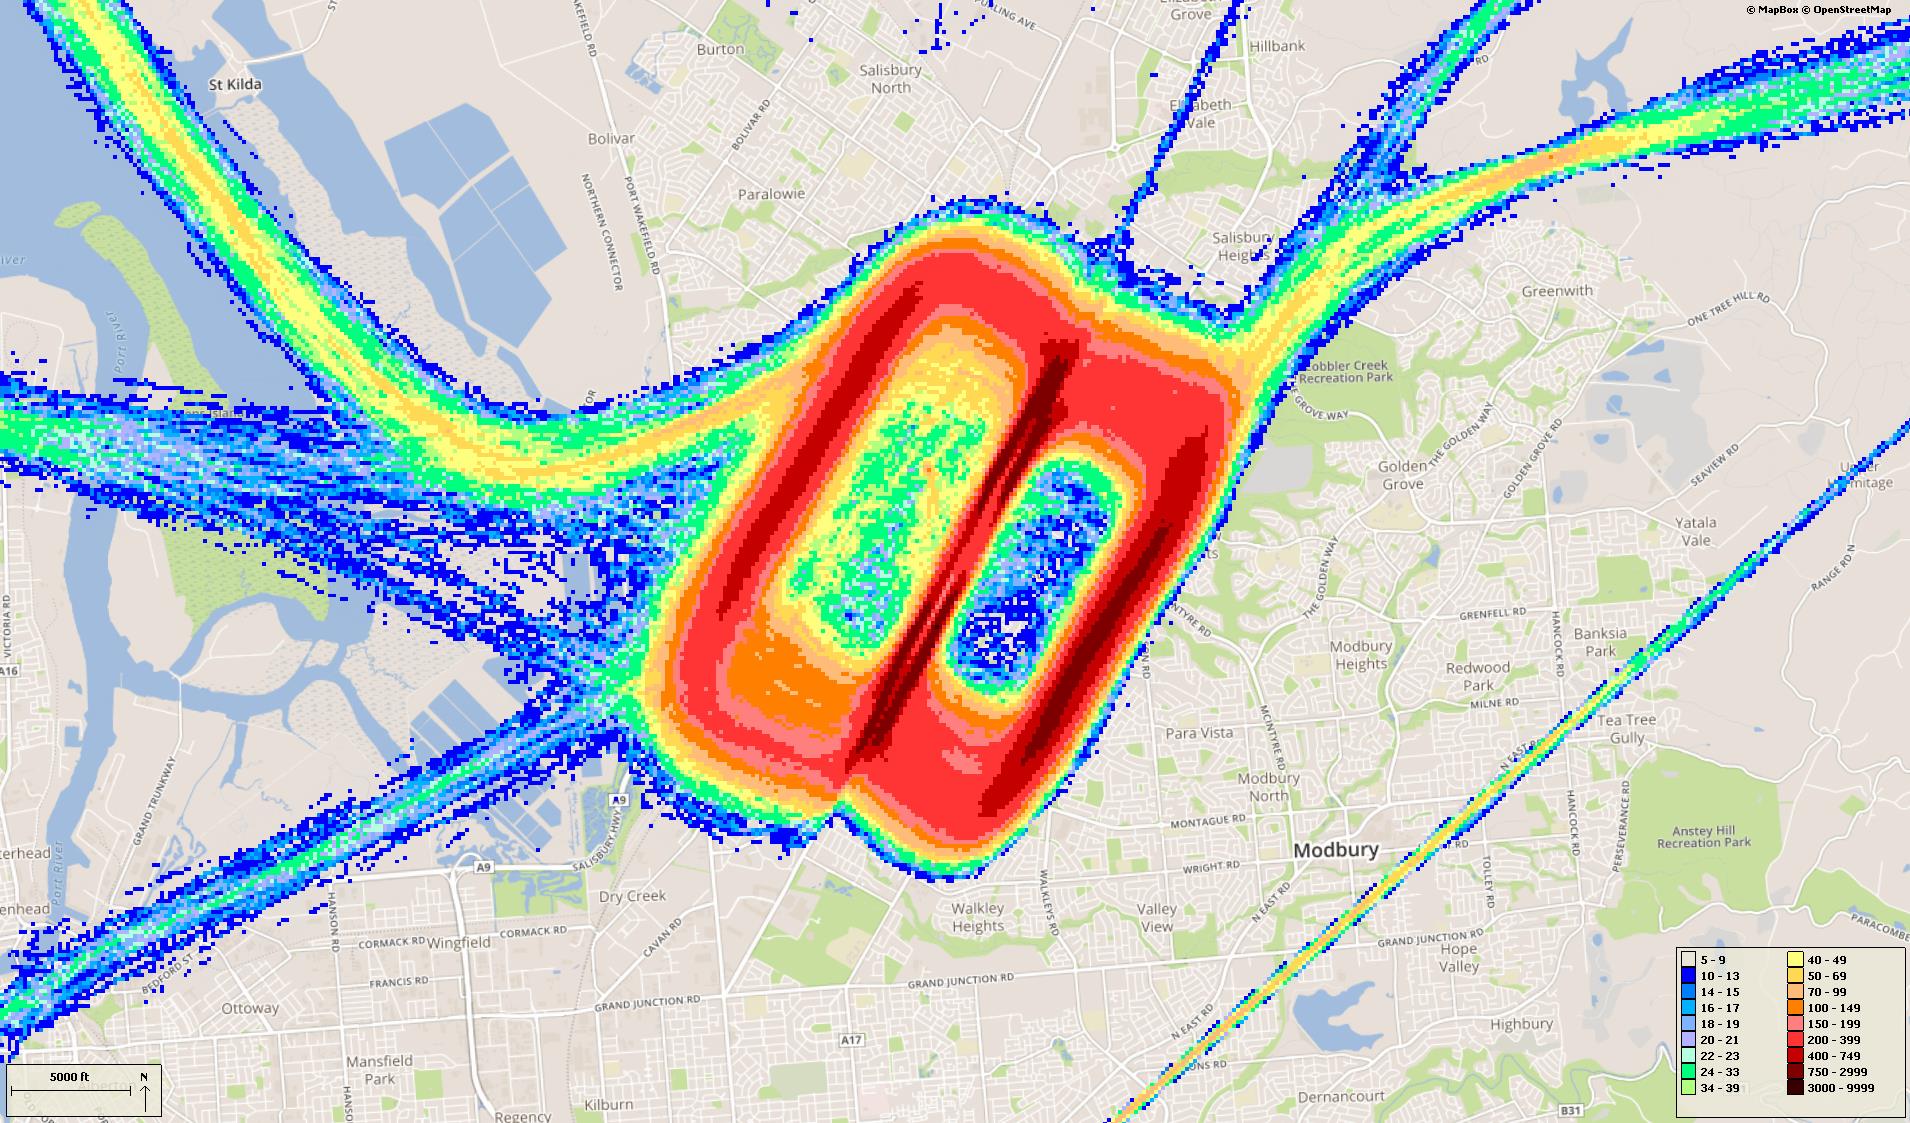
Track density
The following image shows the density of aircraft in the circuit over the quarter. The colour indicates the density – the hotter and deeper the colour, the greater the number of movements. Click on the image to enlarge it and use your “Back” button to return to this page:
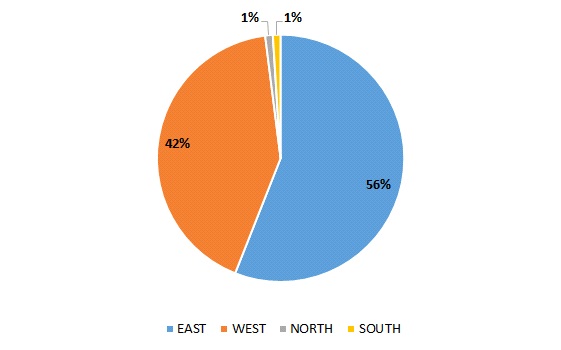
Percentage of circuits on each side of the airport (north/south/east/west)

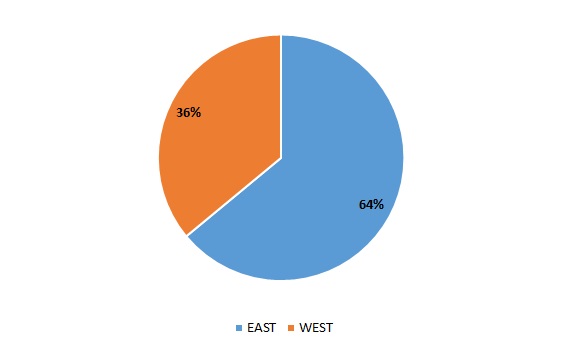
Comparison of percentage of circuits to the east versus west

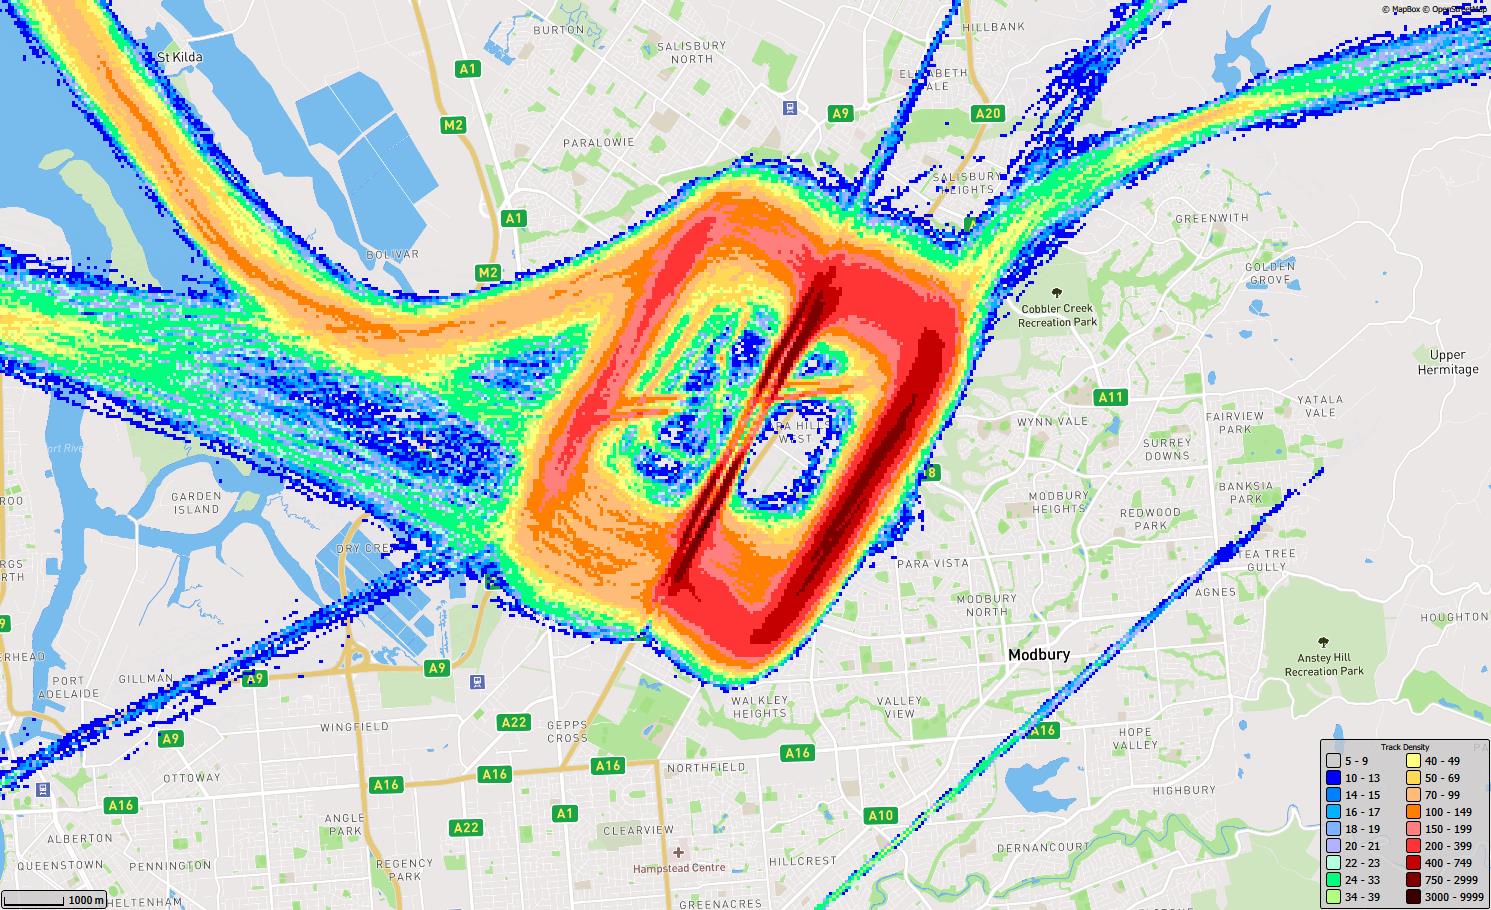
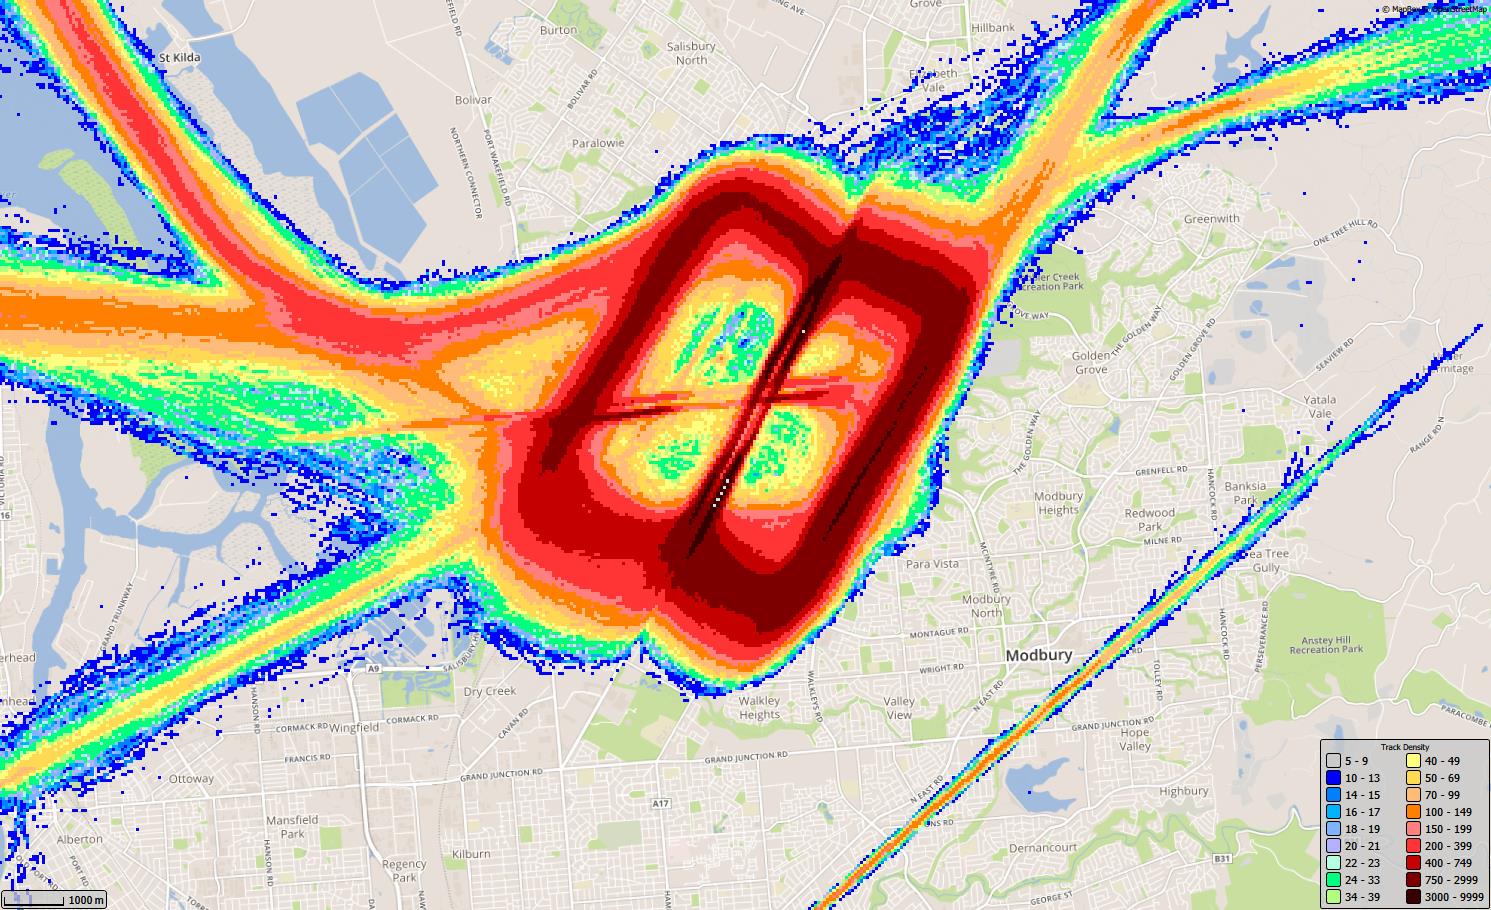
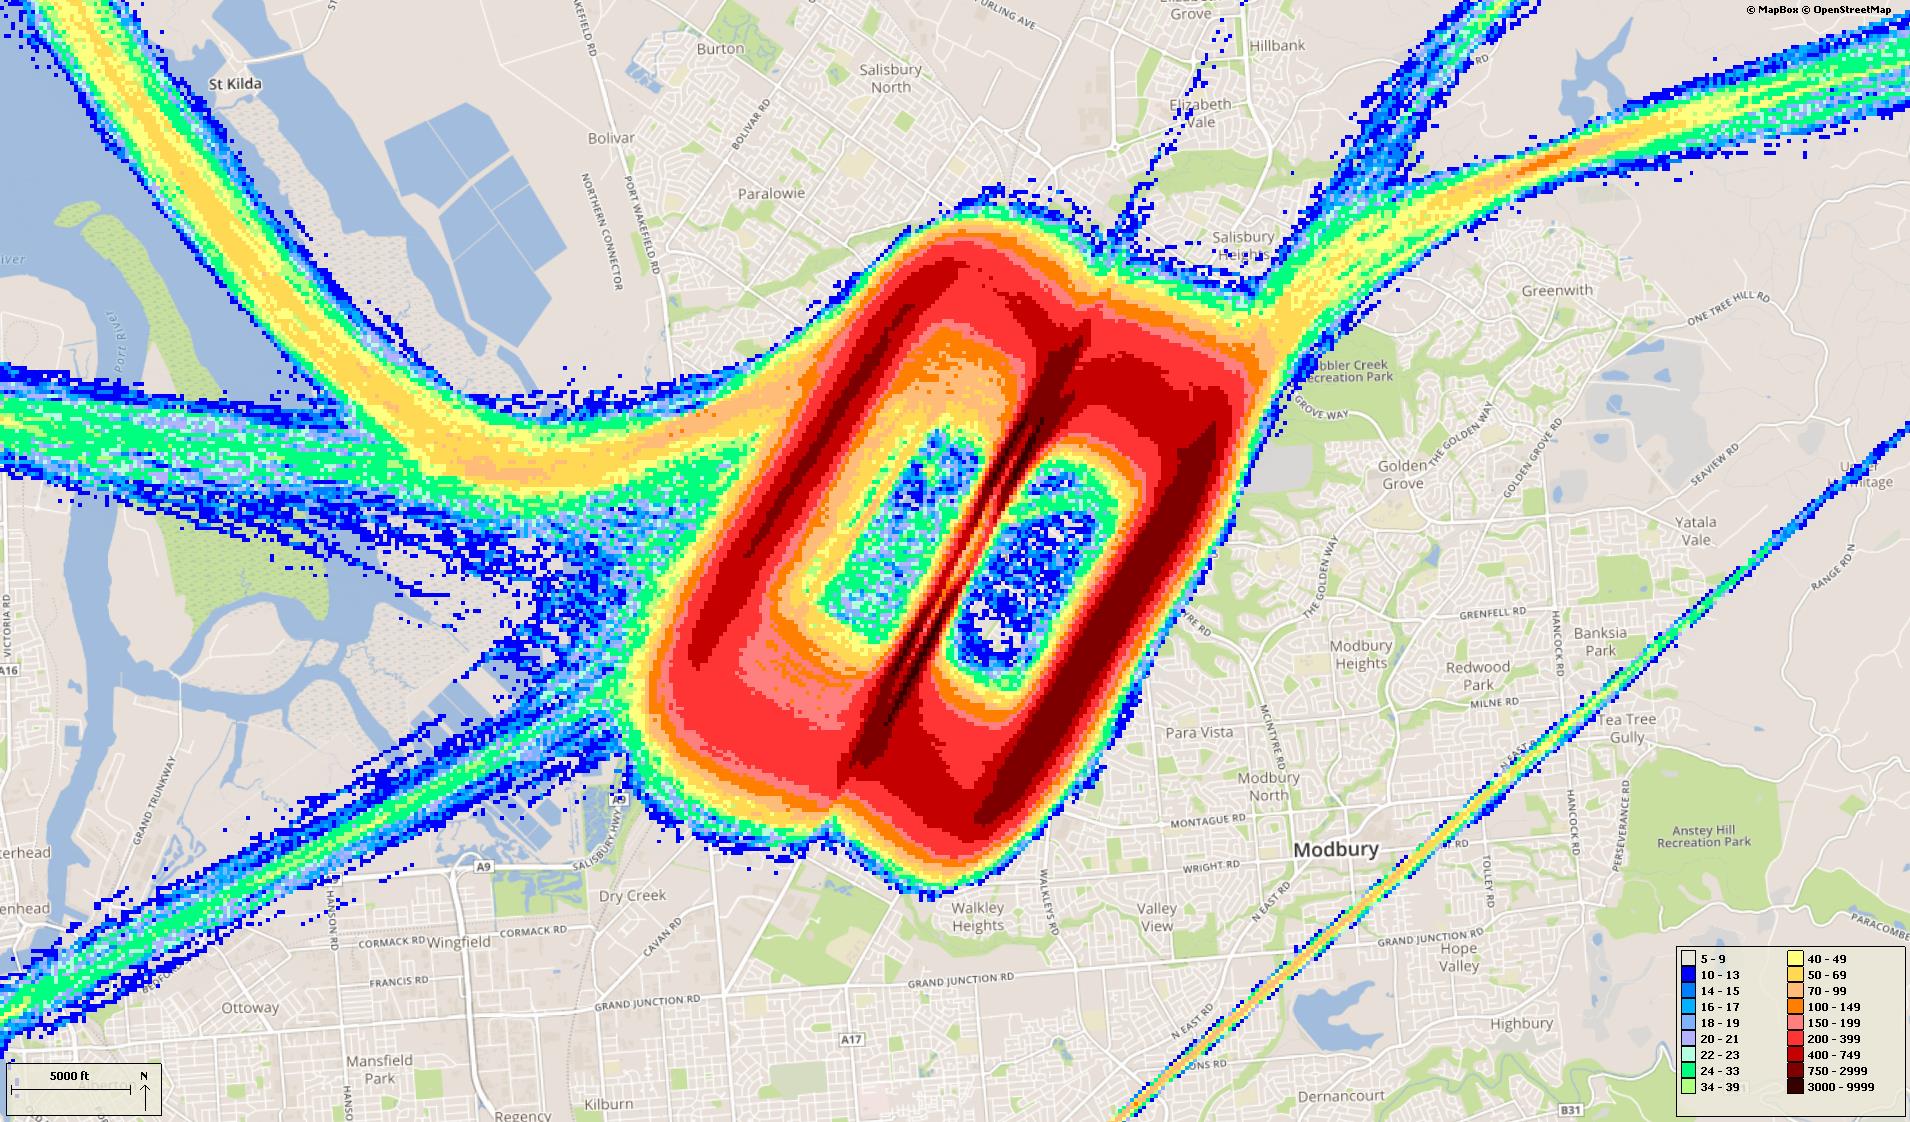
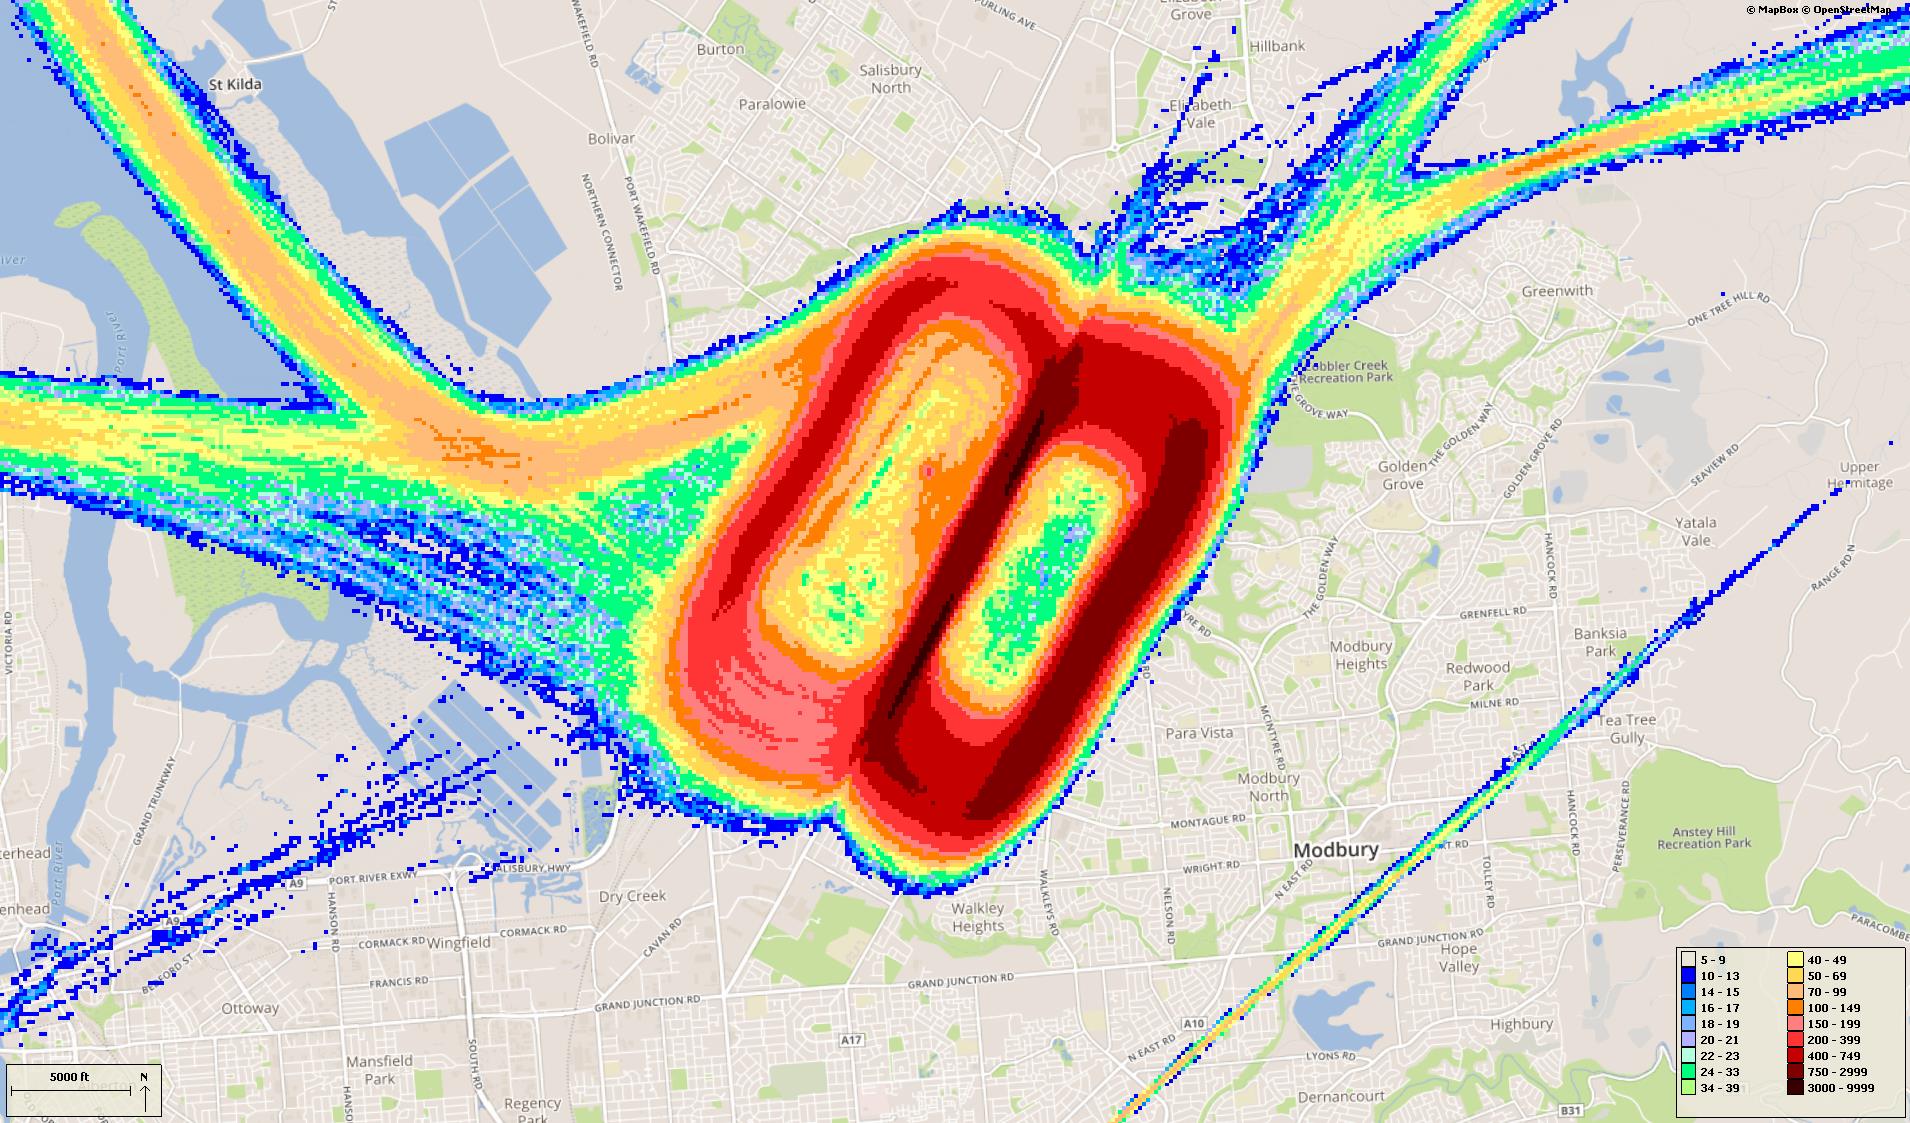
Track density
The following image shows the density of aircraft in the circuit over the quarter. The colour indicates the density – the hotter and deeper the colour, the greater the number of movements. Click on the image to enlarge it and use your “Back” button to return to this page:
Percentage of circuits on each side of the airport (north/south/east/west)
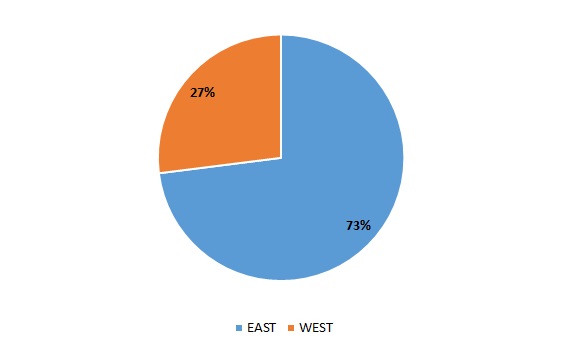
Comparison of percentage of circuits to the east versus west
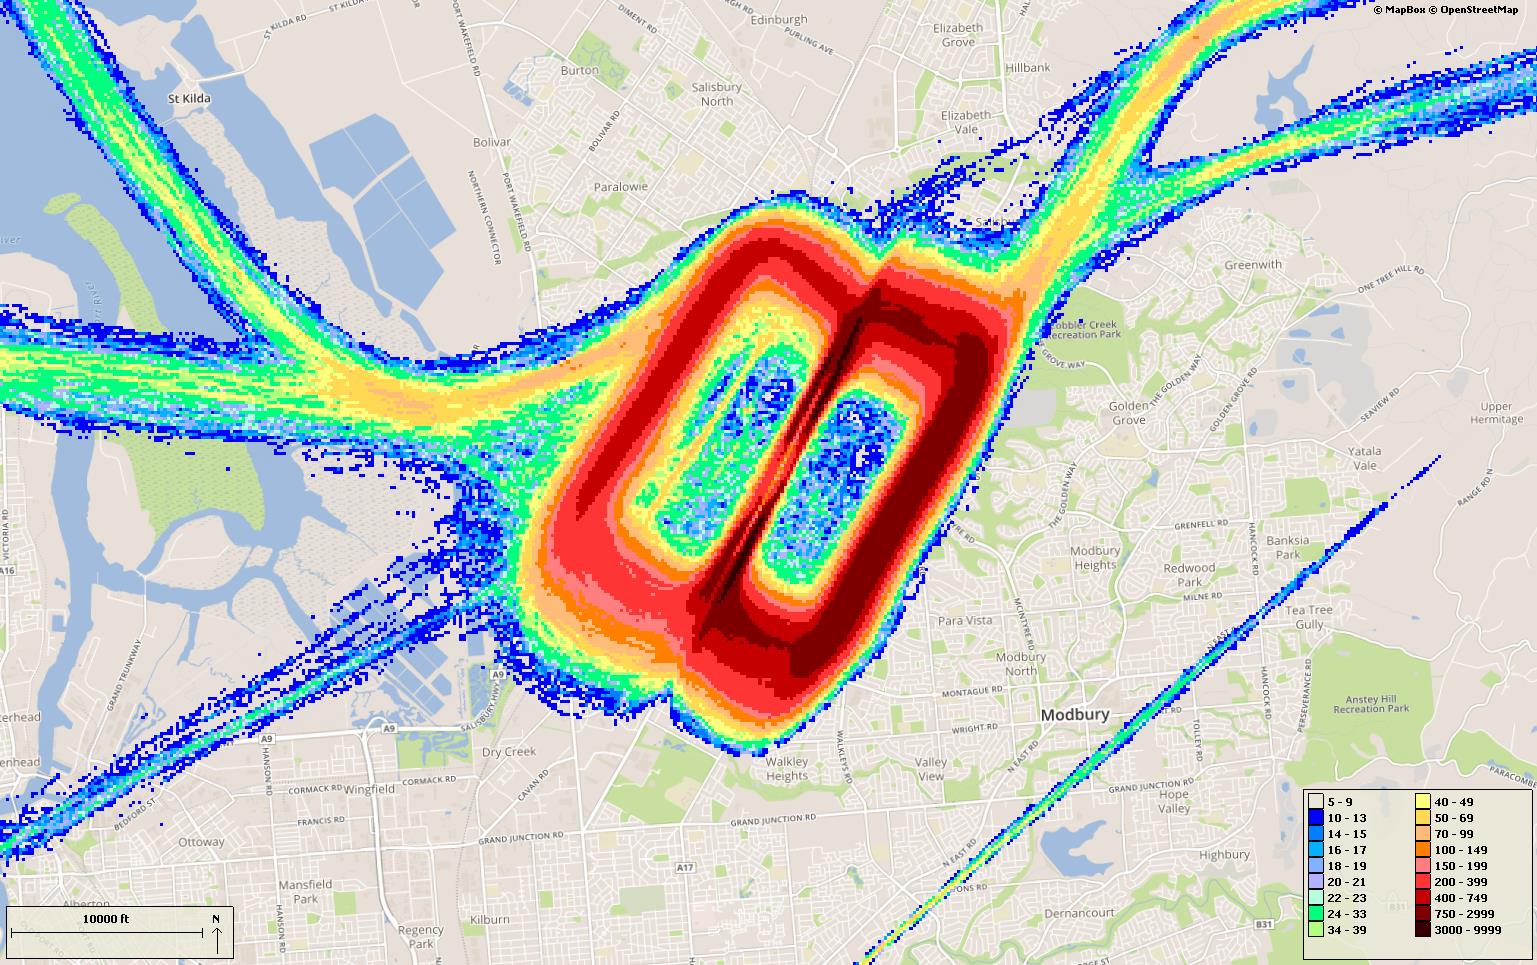

Track density
The following image shows the density of aircraft in the circuit over the quarter. The colour indicates the density – the hotter and deeper the colour, the greater the number of movements. Click on the image to enlarge it and use your “Back” button to return to this page:
Percentage of circuits on each side of the airport (north/south/east/west)
Comparison of percentage of circuits to the east versus west

Track density
The following image shows the density of aircraft in the circuit over the quarter. The colour indicates the density – the hotter and deeper the colour, the greater the number of movements. Click on the image to enlarge it and use your “Back” button to return to this page:
Percentage of circuits on each side of the airport (north/south/east/west)

Comparison of percentage of circuits to the east versus west

Track density
The following image shows the density of aircraft in the circuit over the quarter. The colour indicates the density – the hotter and deeper the colour, the greater the number of movements. Click on the image to enlarge it and use your “Back” button to return to this page:
Percentage of circuits on each side of the airport (north/south/east/west)
Comparison of percentage of circuits to the east versus west

Track density
The following image shows the density of aircraft in the circuit over the quarter. The colour indicates the density – the hotter and deeper the colour, the greater the number of movements. Click on the image to enlarge it and use your “Back” button to return to this page:
Percentage of circuits on each side of the airport (north/south/east/west)

Comparison of percentage of circuits to the east versus west
Track density
The following image shows the density of aircraft in the circuit over the quarter. The colour indicates the density – the hotter and deeper the colour, the greater the number of movements. Click on the image to enlarge it and use your “Back” button to return to this page:
Percentage of circuits on each side of the airport (north/south/east/west)

Comparison of percentage of circuits to the east versus west

Track density
The following image shows the density of aircraft in the circuit over the quarter. The colour indicates the density – the hotter and deeper the colour, the greater the number of movements. Click on the image to enlarge it and use your “Back” button to return to this page:
Percentage of circuits on each side of the airport (north/south/east/west)
Comparison of percentage of circuits to the east versus west
Track density
The following image shows the density of aircraft in the circuit over the quarter. The colour indicates the density – the hotter and deeper the colour, the greater the number of movements. Click on the image to enlarge it and use your “Back” button to return to this page:
Percentage of circuits on each side of the airport (north/south/east/west)

Comparison of percentage of circuits to the east versus west

Track density
The following image shows the density of aircraft in the circuit over the quarter. The colour indicates the density – the hotter and deeper the colour, the greater the number of movements. Click on the image to enlarge it and use your “Back” button to return to this page:
Percentage of circuits on each side of the airport (north/south/east/west)
Comparison of percentage of circuits to the east versus west
Track density
The following image shows the density of aircraft in the circuit over the quarter. The colour indicates the density – the hotter and deeper the colour, the greater the number of movements. Click on the image to enlarge it and use your “Back” button to return to this page: