Noise Monitoring
Airservices collects noise and operational data from five noise monitors (Environmental Monitoring Unit, EMU) around Adelaide Airport.
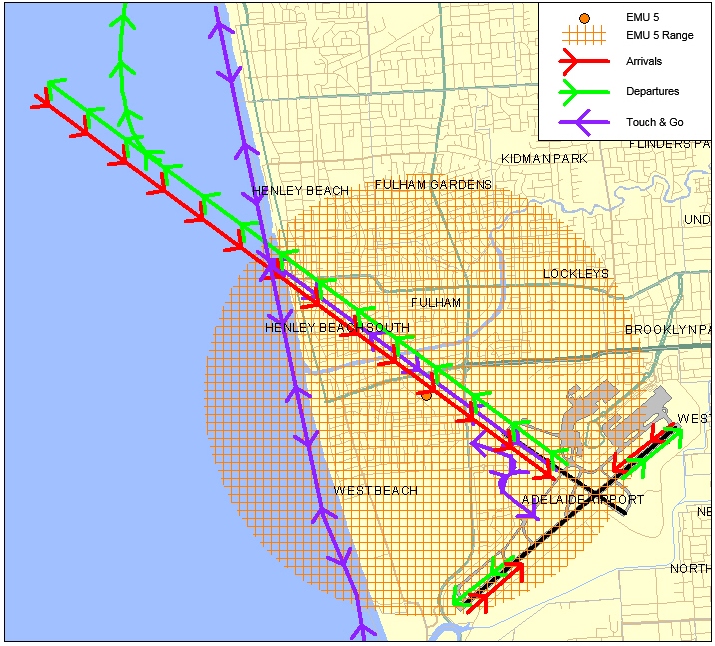
The five noise monitors located at Adelaide Airport:
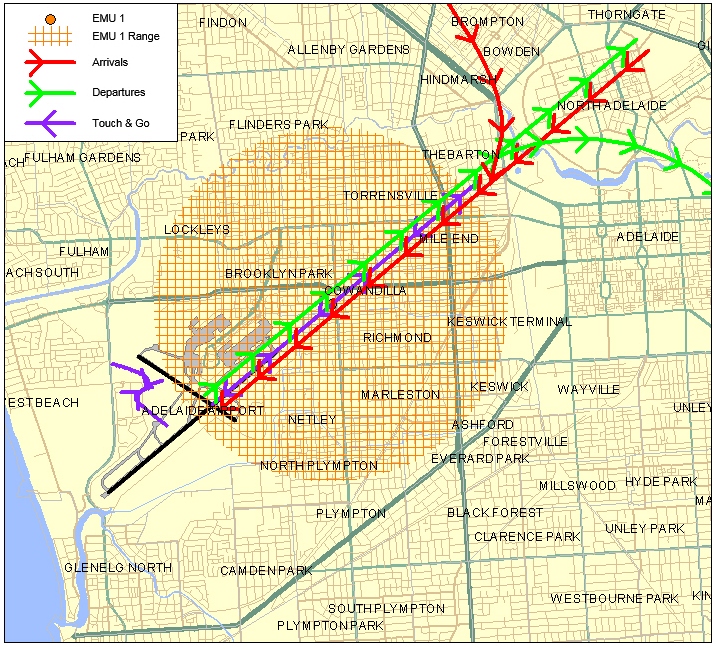
- Captures arrivals to Runway 23 and departures from Runway 05.
- The pattern of noise events reflects the number of departures from Runway 05.
Click to enlarge image and use your back button to return to this page.
-
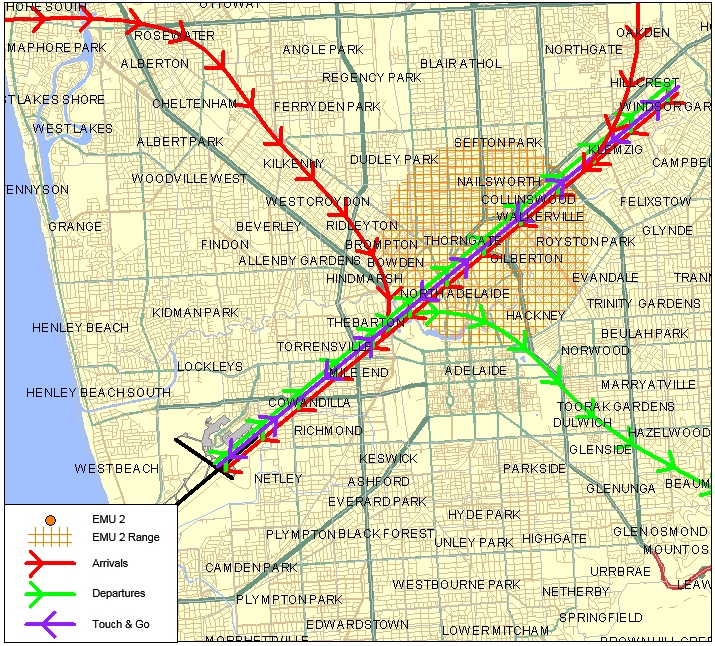
- Captures arrivals to Runway 23 and departures from Runway 05.
Click to enlarge image and use your back button to return to this page.
-
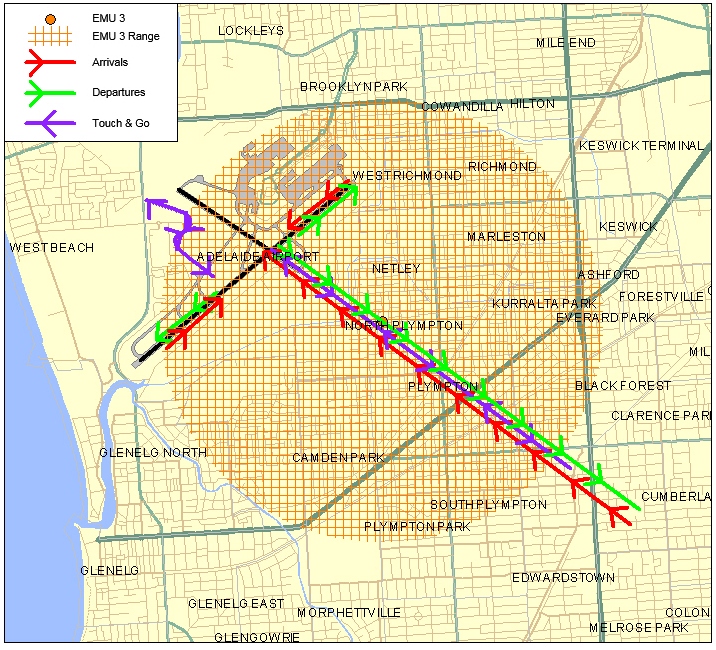
- Located to the south east of the cross runway.
- Due to the low level of use of the cross runway, most of the noise events captured are associated with arrivals to Runway 05.
Click to enlarge image and use your back button to return to this page.
-
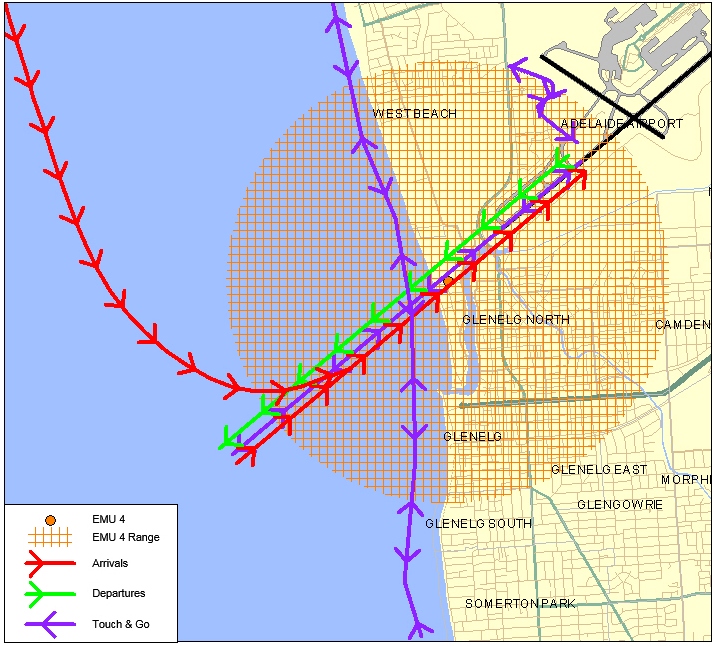
- Captures arrivals on to Runway 05 and departures from Runway 23.
Click to enlarge image and use your back button to return to this page.
-
- Located to the north west of the cross runway.
- Most of the noise events captured by this noise monitor are associated with departures from Runway 23.
Click to enlarge image and use your back button to return to this page.
Noise monitoring is not conducted to determine compliance with aircraft noise regulations – there is no regulated maximum level for aircraft noise. Rather, aircraft operating in Australia are required to meet noise standards imposed through the Air Navigation (Aircraft Noise) Regulations 2018. These regulations stipulate compliance with international noise standards that apply to the design and production of aircraft, and specify the amount of noise that may be emitted by an aircraft type or model. Aircraft that do not meet these standards are prohibited from engaging in air navigation in Australia unless exceptional circumstances apply. This is administered by the Department of Infrastructure, Transport, Regional Development and Communications.
Noise monitoring is conducted to:
- determine the contribution of aircraft noise to the overall noise that a community is exposed to
- provide information to the community about aircraft noise and operations
- help local authorities make informed land use decisions
- inform estimates of the impact of changes to air traffic control procedures
- validate noise modelling
- inform the determination of aircraft noise policy by government and assist in the implementation of legislation.
More information is available on the Monitoring Aircraft Noise page.
Access noise monitoring information for each quarter below.
Average daily noise events over 70dBA
Noise monitors are shown below as solid purple circles. The figure appearing in each circle is the daily average number of noise events over 70 decibels (dBA) for the period selected.
How to: Click the (i) icon within the tag on each monitor, or the applicable radio button below the map, for further information about the data collected by that noise monitor. The charts and table below will change with your selection.
Hourly distribution of noise events above 70dBA
Distribution by event level
Aircraft event levels (correlated), dBA
Average daily noise events over 70dBA
Noise monitors are shown below as solid purple circles. The figure appearing in each circle is the daily average number of noise events over 70 decibels (dBA) for the period selected.
How to: Click the (i) icon within the tag on each monitor, or the applicable radio button below the map, for further information about the data collected by that noise monitor. The charts and table below will change with your selection.